Dow Support Levels

5:49 am PST.

I am looking to continue the long side trade on the Dow. It looks like gold will fall and so I will stay away from the mining stocks for now until SLV can close above 16.23. I exited my mining stocks premarket with gold down about $2. Holding onto DIA long.

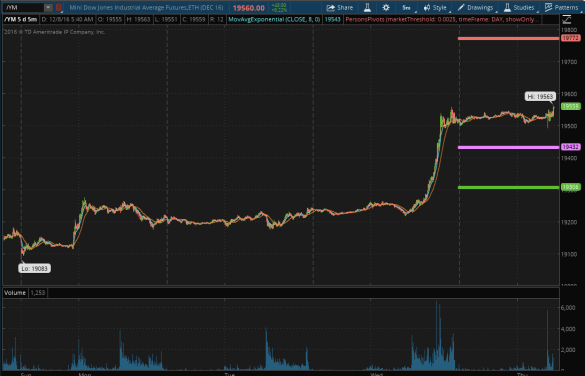
/YM has support at 19432, and room to rally to 19772 today. $INDU support at 19344.

screen-shot-2016-12-08-at-5-44-10-am

Closing above the QQQ prints I spotted on Tuesday at 116.63 – I believe there were more than 5 million traded at that price – made a big bullish signal.

The Dollar Correction is Done

5:41 am PST.

The dollar made a new low this morning as yesterday’s close suggested it would and has now rallied strongly off that bottom. I expect the dollar to make new highs in the coming weeks.

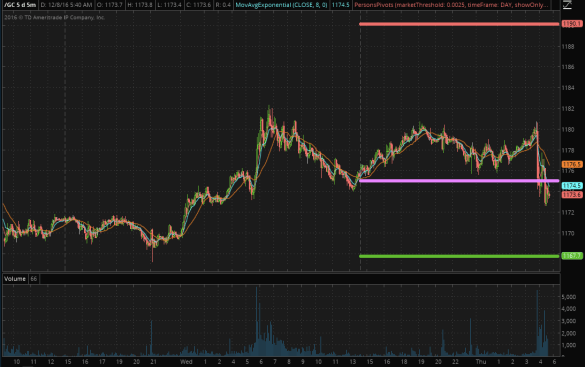
It is going to be interesting what happens here with silver and gold. Can gold and silver rally with the dollar today or will they fall?

/GC currently under the pivot. Next support is 1167.7

screen-shot-2016-12-08-at-5-40-11-am


Markets are Fractal

nautilus-feat-jpg-653x0_q80_crop-smart

aloe-spiral

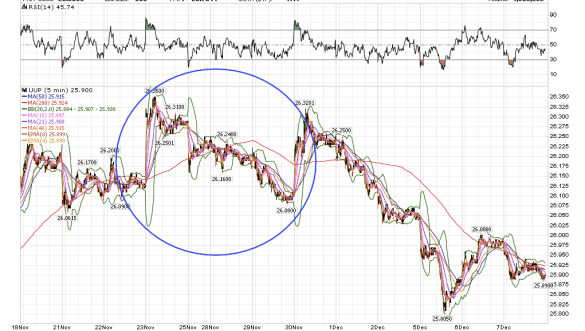
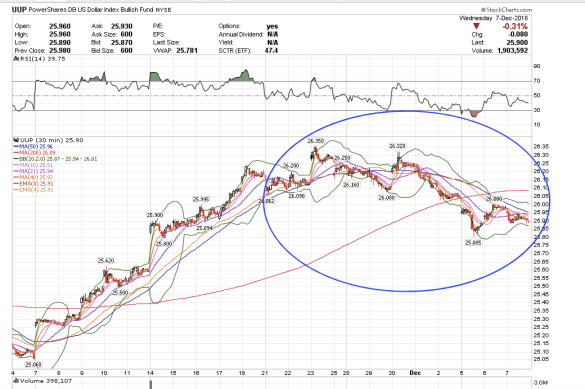
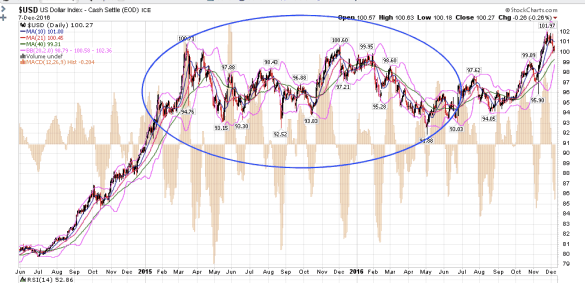
Markets are made up of repeating fractal patterns on every time frame. When first looking at the whole and then going deeper into the minutiae of what makes up a whole, one finds that the minutiae look just like the whole. So it is with the markets.

Do any of the circled price fluctuations look similar?

5-min chart

screen-shot-2016-12-08-at-5-09-29-am

30-minute chart of UUP

screen-shot-2016-12-08-at-5-07-23-am

Daily chart of the US Dollar

screen-shot-2016-12-08-at-5-16-30-am

I see the fractal nature of the markets. The price pattern that exists on the 5-min chart shorter time frame looks very similar to the price pattern on the 30-min longer time frame, and just as similar on even longer daily time frame for the same underlying instrument which is the US Dollar.

Corrective price actions look similar with A-B-C waves. Impulsive waves look similar as well. The above U.S. Dollar fractal patterns are corrective in nature.

The following are fractal patterns that are impulsive in nature first looking at the larger picture and then zooming into the minutiae:

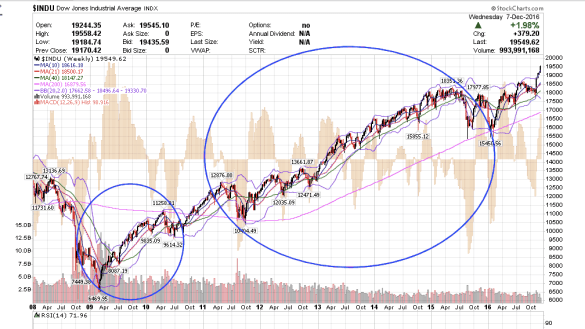
Within the Dow Weekly the two circled patterns show the first shorter leg at the beginning of the rally looks very similar to the larger middle part. They are fractals of each other both comprising the whole.

screen-shot-2016-12-08-at-5-25-21-am

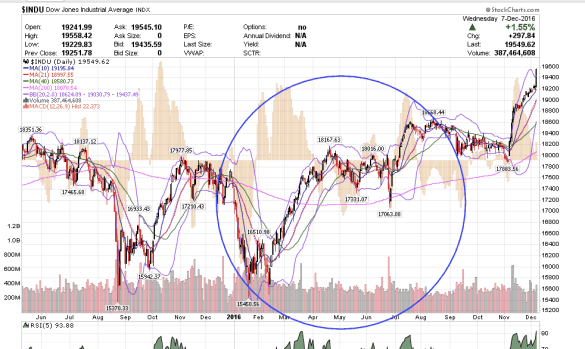
The Dow Daily. Zooming into just this year, the impulsive price action looks just like the fractal at the beginning of this entire rally during 2009.

screen-shot-2016-12-08-at-5-26-25-am

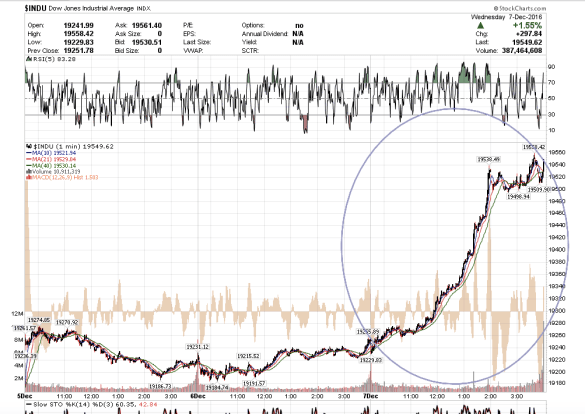
Here is the Dow on the 1-min. It looks similar to the circled price pattern above. screen-shot-2016-12-08-at-5-30-36-am

12/7/16 Close

wall-street-bull

1:24 pm PST

Well that was an interesting close! After dipping into the red at the morning’s open the Dow kept creeping up all day until buyers started to really rocket it higher.  The volume is coming back into the indices.

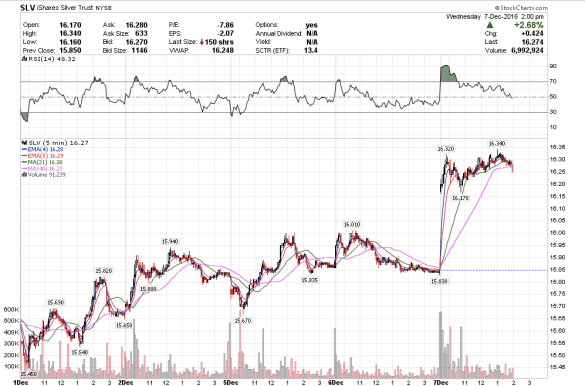
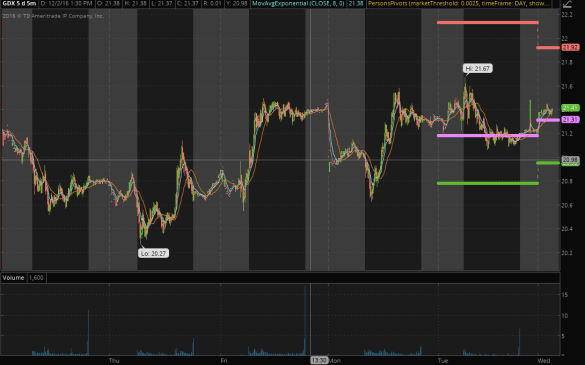
The mining stocks sold sharply off into the close, but GDX, SLV, GLD, and ABX managed to keep their gaps open however slight. SLV closed right on 16.23, and IAU closed right on 11.29. The 21 sma is still resistance for GDX. GDX made its first attempt at the 21 sma yesterday, the second attempt today, and we will see if tomorrow the third attempt will rally through. GDX had a 500,000 print at 21.45, we closed a penny below.

PAAS looks bullish for tomorrow.

The dollar closed weak and we might see continued weakness tomorrow which might help the precious metals. The USO closed lower as did UNG.

The emerging markets etf, VWO, also saw some nice buying. VWO had a 1,332,961 print at 36.50 and closed above. DE also closed above today’s print.

6:01 p.m. update: In answer to SKT’s question, I usually do not like to buy into weakness such as in the case of USO and UNG today at the close unless there is a huge amount of dark pool buying, and even then, I would be cautious. I generally would want to see a clear move to the upside first, then a pullback and higher low which usually provides a lower risk opportunity to go long. That said, UWTI did see some dark pool action at 23.14 with about 1.9 million shares traded at that price. UWTI did close above it, but it also closed red, so it is a mixed signal. UWTI also closed under the 4 ema, but just over the 8. I would like to see a close above the 4 ema to become more bullish. UWTI’s gap down remains open, which generally means more downside.

UNG has had a great run. I almost wish I had bought into it several weeks ago when it broke above 7.55. It definitely looks good for longer term, short-term this is probably a wave iv pullback, with another wave v higher before another consolidation.

Thank you for the questions! I love the questions.

Regarding another question I had from reader C, I use Stockcharts and TOS for charting. I also just looked into DAS Trader Pro. Technology helps with trading but trading well is really about eye training. Jesse Livermore did famously well without a whole lot of software at his disposal. He did well because he knew how to read the tape. He understood the price fluctuations.

Regarding Martin Armstrong, I love him for his vast depth of historical knowledge regarding the markets. He is a walking financial encyclopedia, a good man, hard working, and I admire him. I like to know his overview of capital flows and I like his ECM model. His benchmark targets from his 2014 Gold report absolutely stunned me with their accuracy.

Martin Armstrong also stated at the 2015 WEC that the Dow would rise first as international money seeks a place to park. The S&P is for domestic money, and the Nasdaq would rally last. It looks like his words ring true today. We can see the Dow and the SPX rally much more strongly versus the Nasdaq. The QQQ lags, but it has a very clear pattern to it, which I see, that we have begun the phase transition to the upside that he has written and talked extensively about.

On the flip side, I am not sure that I completely agree with his thesis that gold must break below $1000. I do have the possibility of break down on my radar and so I am cautiously bullish on the mining stocks like PAAS, but his thesis has to fit with what I currently see on the charts. For me, looking at a bunch of different mining stocks, what I see is a higher low, multi-month bull flag, and another buying opportunity here. He has recognized that gold may have bottomed on his first benchmark target December 3, 2015, that is why he set his confirmation level at around 1270. He did also say that gold will be in a bull market when it rises in all currencies. So, we have to look to see whether gold can rally along with the dollar and close the year above $1270. Granted, it is a lot to ask. My own conservative level for gold confirmation of a bottom is about 1250-60. For SLV it is 16.23 and SLV closed right on it today, not above it. Presently the dollar and gold trade inversely. However, there is the possibility that gold can rally here along with the dollar. Gold just needs to prove itself.

The arrays on Socrates are only sometimes useful and I find them more of a distraction as they change often, which can be good but also distracting. The reversals are useful for longer time frames, but not sensitive enough for my daily and intraday transactions. I also do not know how they are generated because he keeps it secret. When I do not fully understand something it is hard to fully make use of it, but I do like to know where the reversal levels are sometimes. Other times like now I do not use them at all because I do not have access to Socrates and I feel fine.

I like my moving averages a lot better. It appears Marty uses his reversals much like how I use my moving averages. 🙂



Keeping the Gap Open

11:04 am PST

Days like today are really exciting for me when everything starts to line up.

Silver has to keep this morning’s gap higher open with an SLV close above 16.23 for it to continue climbing higher tomorrow. If the gap remains open and we close above it, we will probably see more upside for tomorrow on silver, gold, and the mining stocks.

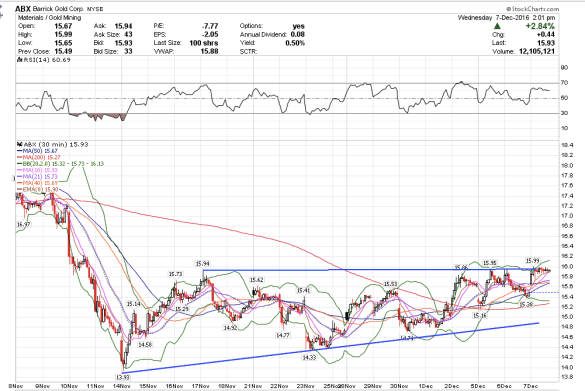
ABX is trading above yesterday’s block trade prints @ 15.59 and is about to break out of its consolidation. ABX is also bumping up against the broken neckline from November.

IAU is also now trading above the 5 million @ 11.29 prints from last week and has to close above it to be bullish.

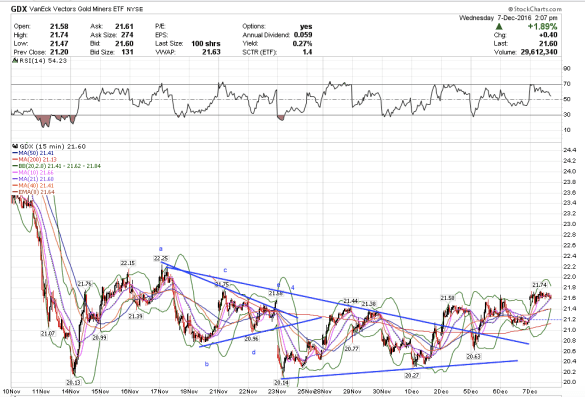
The 21.70 area with the 21 sma has been containing the price movement for GDX. If it can close above it, I think GDX could have a really nice move to the upside tomorrow.

At the same time, there is an outside possibility we could see an island gap reversal to the downside tomorrow morning if the dollar starts to strengthen. We could see a hard sell off into the close, which would imply a gap down tomorrow. A trader always has to look at all possibilities. 🙂

screen-shot-2016-12-07-at-11-00-54-am

screen-shot-2016-12-07-at-11-01-19-am

screen-shot-2016-12-07-at-11-07-39-am

DE is a buy

7:54 A.M. PST

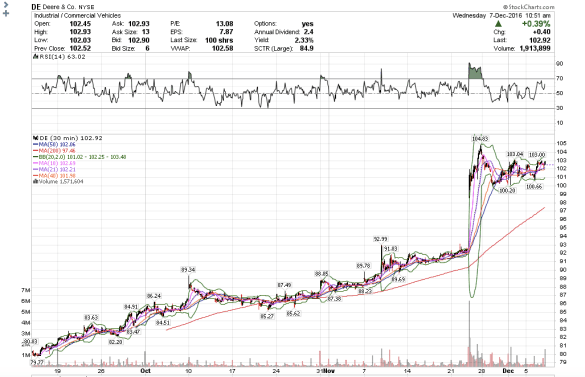
Market Makers are buying Deere & Co this morning. I saw 1,421,800 shares in one block traded at 102.60 a few minutes ago. The pattern looks really bullish too. I would like to buy DE today on a close above 102.60. Target 106.50 over the next week or so, stop 102.

screen-shot-2016-12-07-at-7-51-26-am

IWM Ready to Top?

7:15 a.m. PST

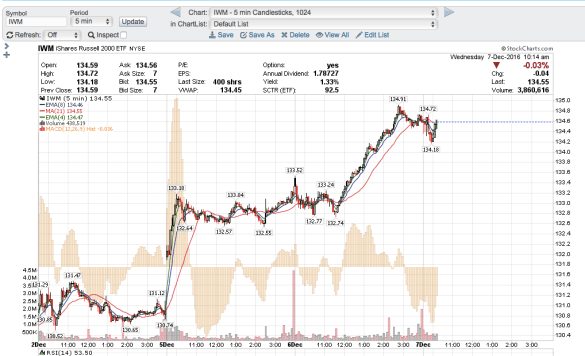
The IWM looks like it wants to make another new high to 135ish. If it goes up to 135ish and then closes in the red today on volume, that would make a nice topping upthrust pattern. It also has negative divergences on the daily and 30 minute time frames. Open red, new high, close red is a common interim topping pattern. Support at 133.57.

Or maybe we will inch higher into the Fed meeting next week.

screen-shot-2016-12-07-at-7-14-43-am


Has Silver Bottomed?

6:27 a.m. PST.

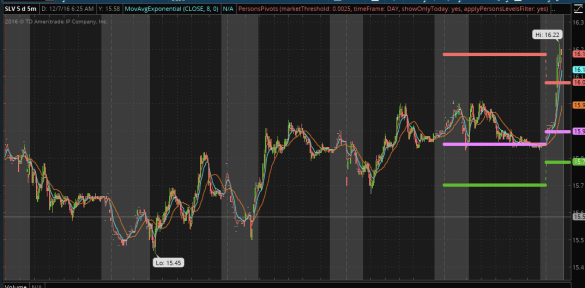
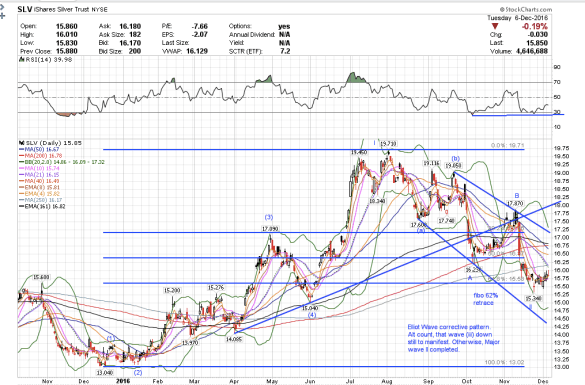
Silver is starting to look really really bullish this morning. I have written that if SLV closes above 16.23, I would become a lot more bullish on the metals and mining stocks. A close above 16.23 will create a bullish wave overlap in Elliot Wave terms which means that either the bottom is in for the metals or the next wave down is going to be even more severe than the drop from 17.87 to 15.34. SLV has had a series of overlapping waves since its August top that look more corrective than impulsive.

I love how this morning the pop higher stopped just shy of 16.23 by .01. Just amazing how traders seem to know there is some importance with 16.23. Well at least in my mind. 🙂

Screen Shot 2016-12-07 at 6.23.46 AM.pngscreen-shot-2016-12-07-at-6-24-48-am

Watching GDX this morning

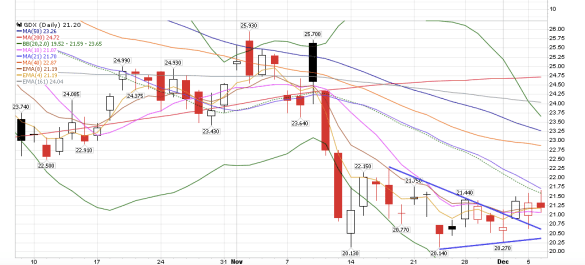
GDX has moved slightly up this morning in pre-market trading. I will look for a possible rally first to the 21 sma  now at 21.70 for a second attempt, and then the next level up to 21.92.

GDX might need a third attempt at the 21 sma. If it can rally above the 21 sma I will look to 21.92.

Stop 21.31.

Gold would have to close above 1180 today to have a chance at rallying to 1201 this week.

screen-shot-2016-12-07-at-5-49-55-am

screen-shot-2016-12-07-at-5-46-42-am

Thank you SKT about asking about the time of my posts and being able to pop out the pictures. Nice of you to think about that. I will try to look into that today. Now 5:53 PST, 8:53 EST.