
10:41 am PST. The HSI is starting to look like an intermediate sell to me.
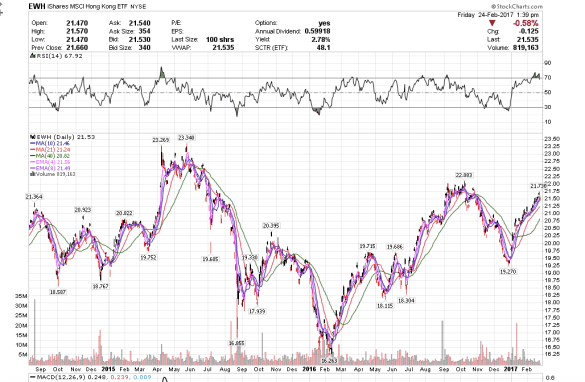
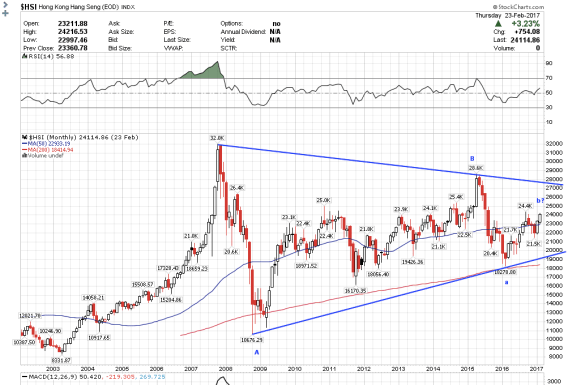
10:41 am PST. The HSI is starting to look like an intermediate sell to me.
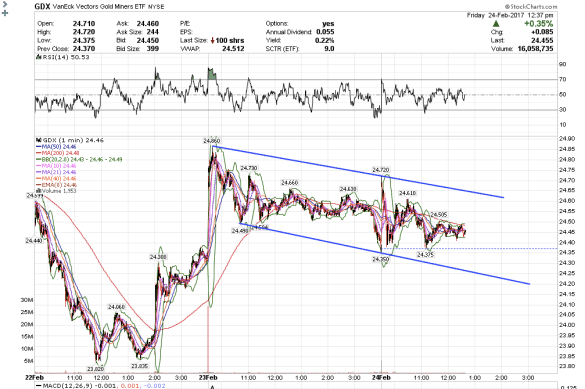
9:38 GDX has another bull flag on the 1-minute fractal. I think the correction is done.
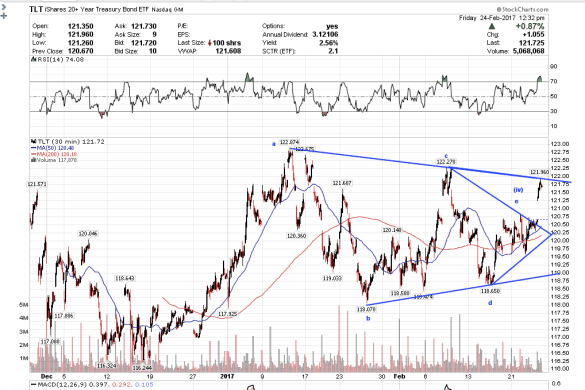
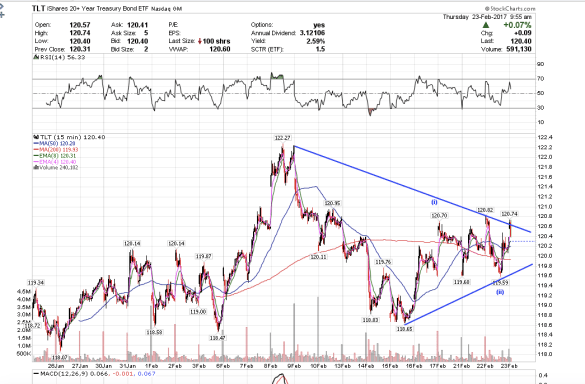
TLT broke up out of the first wedge and is about to do so on the second larger one. If SPY fails to make a new high, that might just be it, possibly until November. Major wave 4 might be right around the corner.
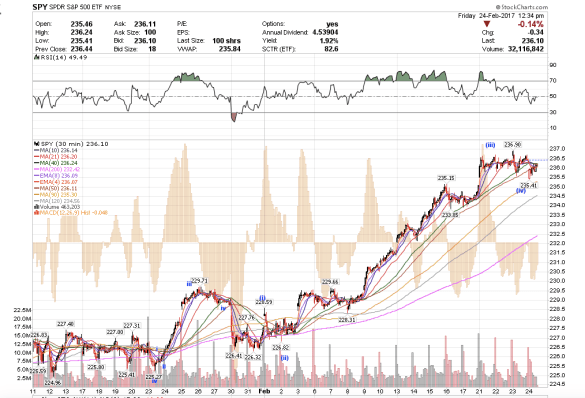
6:37 am PST. Adding onto my long-side positions here on this pullback after the gap up.
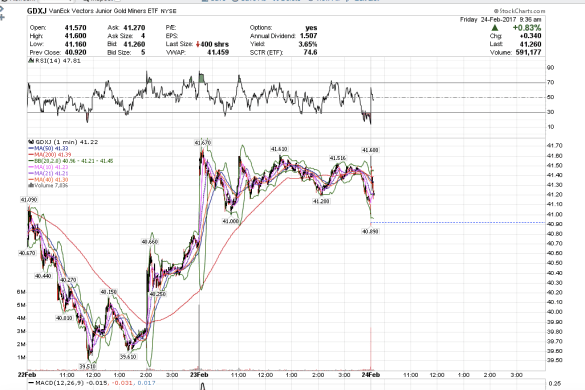
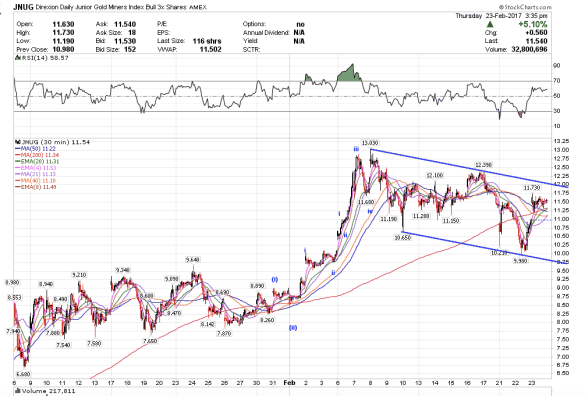
3:58 am PST. I stopped out of my QQQ. JNUG jumped right back up after yesterday’s head fake sell-off. This is uber bullish price action in the gold, silver, and precious metals mining stocks. I actually bought back in after the close yesterday on JNUG at 11.20, but it was just a small position, because the sell-off looked suspicious like a potential wave ii and I wanted to test it. Gold looks like it could close this week above the critical 1243.20 level. Then I will look to see if it will close the month above to confirm the new wave 3 up is on.
I am not going to try to attempt going long the indices anymore. With TLT, gold, and silver looking bullish, it is just not worth the risk. We are so close to a top everywhere I look on the Dow, SPY, QQQ, retailers, corporate bonds, airlines, and banks. It is not worth trying to get those last few dollars that might not happen.
First level of support for QQQ is 128.86. If we close below that, I might buy puts.
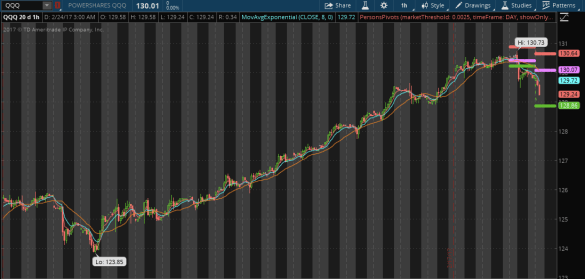
1:05 pm PST. QQQ going to make a new high. Long.
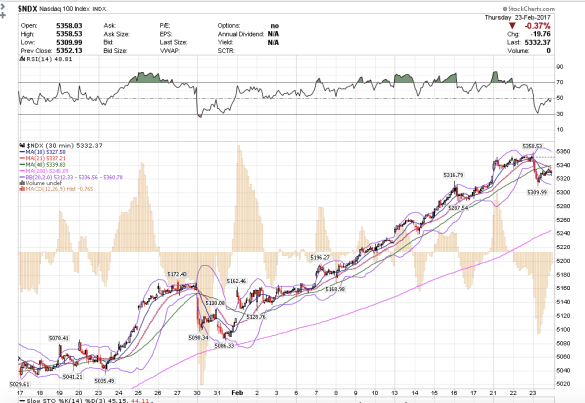
1:00 pm PST. I took profits on JNUG +.90 avg. The miners sold off into the close.
12:35 pm PST. I have been long JNUG from 10.35 since yesterday. JNUG is going to break up out of this bull flag formation. It appears a lot of people are still bearish on gold thinking it is going to break below $1000. That is interesting. Well I trade my own indicators. I do not use Socrates. Yes, I am going to see MA even though I do not really use his system or fully listen to his market forecasts, because I like the guy. I like his outlook on global macroeconomics, politics, and cycles theories. Plus, I want to have a reason to see Hong Kong for the first time. He makes me think, dig deeper, and has helped make me a better trader. In fact, I have gained a lot more confidence in myself as a trader knowing that I can trade on my own and not have to rely on someone else’s take on the market, especially someone with an illustrious track record.
I expect SPY to make a new high tomorrow or next week. TLT is starting to look bullish. Gold and silver still look bullish to me.
Happy Trading!
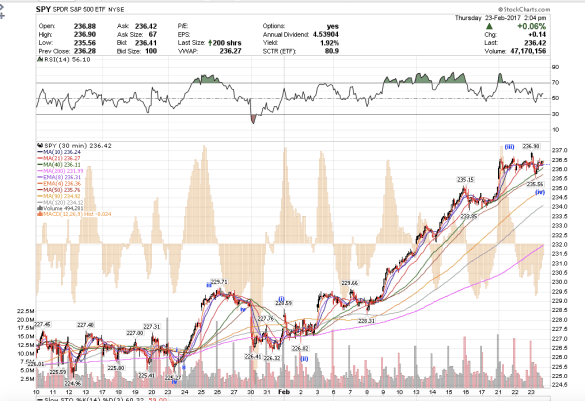
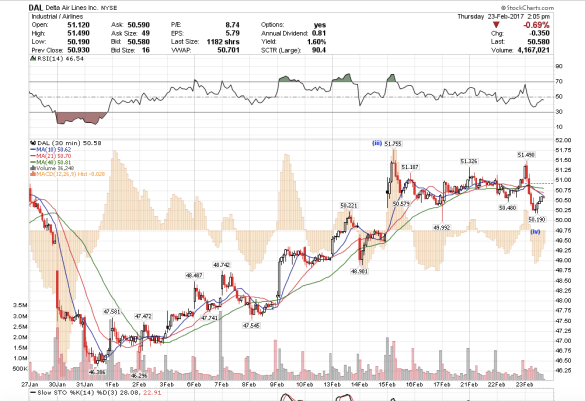
11:06 am PST. I looks like we finished wave (iv) on SPY and DAL, now it is probably time to rally to another new high.
7:27 am PST. GS also looks like it is in a final wave iv-v/(v).
8:09 am PST. I personally am no longer taking any more long-side positions in financials, the indices, or the airlines. I am not short just yet, but watching for a short trade. Or I might just stay long gold.
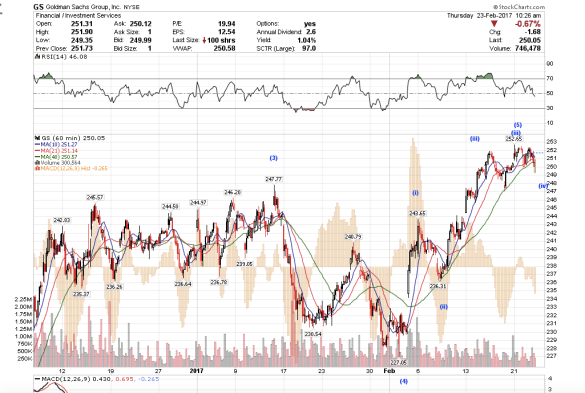
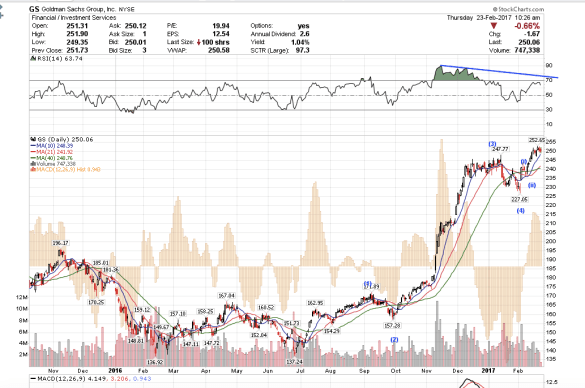

This rally in the indices is not going to be done until the airlines are done. To me, it looks like the airlines have a few more dollars to go on the upside, we are getting close.
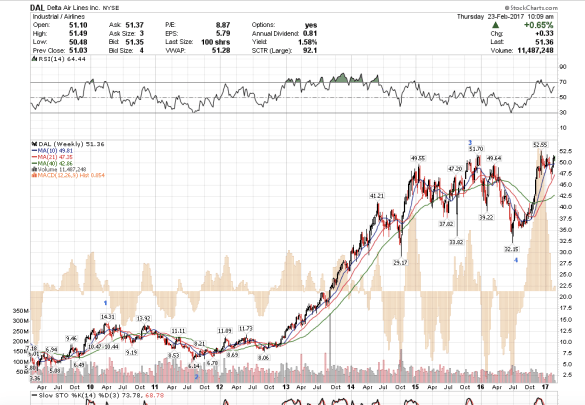
Delta Airlines in the final wave v/5. Can probably go to $53.
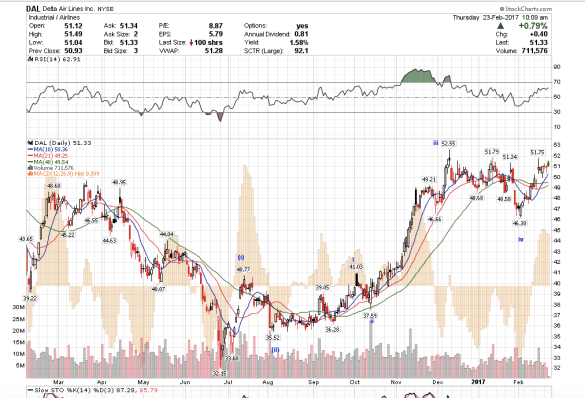
Delta airlines on the daily fractal.
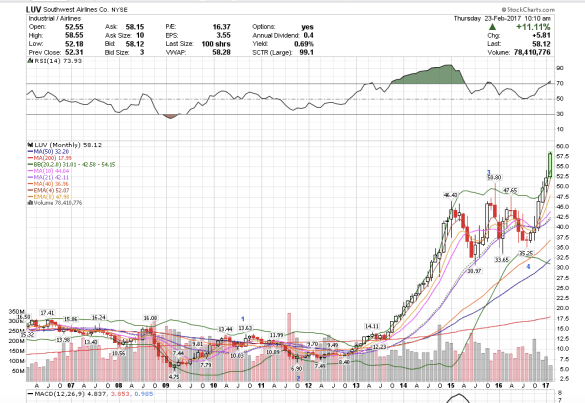
Southwest airlines showing the same wave structure as DAL.
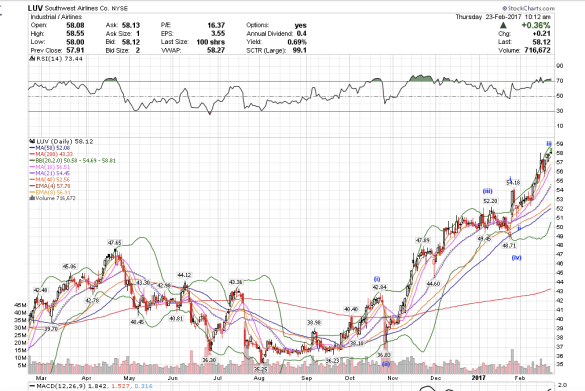
Southwest on the daily fractal.
6:56 am PST. TLT is going to be key to watch for clues on the Indices and gold.

I booked my ticket to Hong Kong for the Martin Armstrong May conference. This will be my first time visiting Hong Kong. And this will be the first time I have ventured outside the United States by myself in 20 years. I cannot believe it. My passport was so expired. lol.
5:02 am. Gold futures are now trading above the critical 1243.20 level and are up more than $10 this morning. Yesterday’s reversal was definitely an interesting one for gold, silver, GDXJ, and treasuries. Gold has to close the week and the month above 1243.20 to signal a more significant rally ahead. I had mentioned 1243.20 as the critical overlap point to confirm that a new leg in the gold bull market was underway. You can see that once we overlapped 1243.20 gold pulled back because the market needed a rest. It took a lot of energy to do that. Now we will see if it is time to rally again.
I want to post my GDXJ and gold charts up.
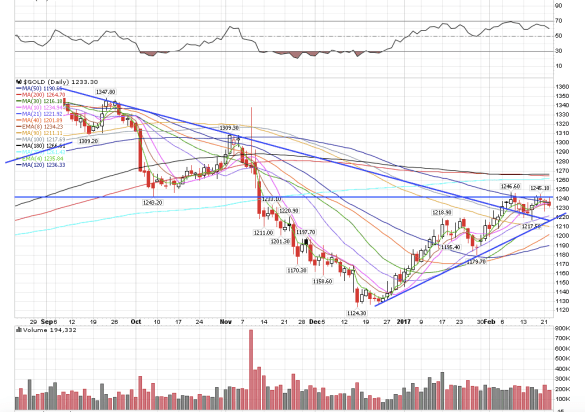
Gold also broke up out of the downtrend line from July and has stayed above it for two weeks now. The critical resistance level is 1243.20 that the market has to close the week and month above to signal a new bull leg up.
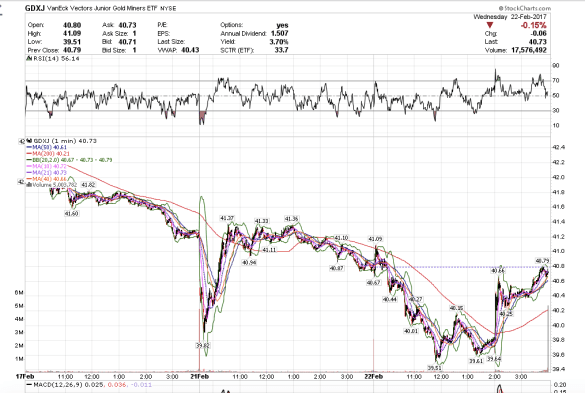
GDXJ made a new low yesterday and then rallied back up to break even at the close.
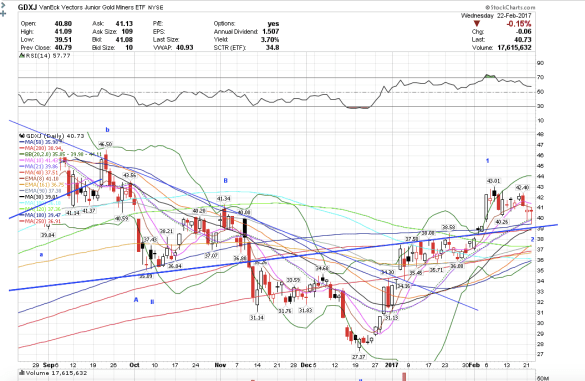
GDXJ backtested the neckline that it rallied back up above and looks like it is holding it as support. Very bullish price action.
 My Journey Towards Understanding the Markets