
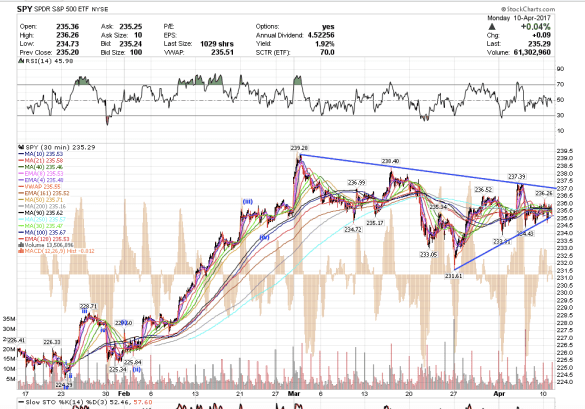
1:02 pm PST. SPY closed just barely green after very whippy action. The triangle still holds for now.
1:02 pm PST. SPY closed just barely green after very whippy action. The triangle still holds for now.
9:35 am PST. Closed JNUG over-weekend swing +1%.

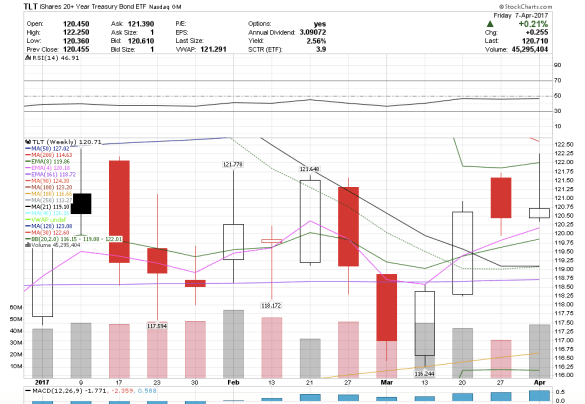
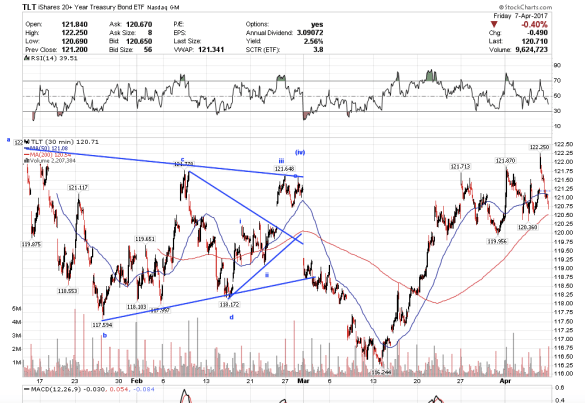
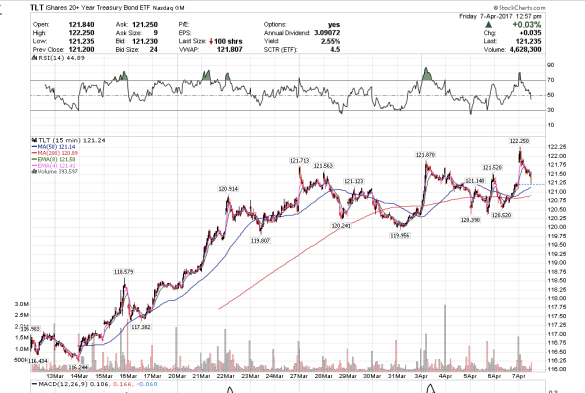
8:10 am PST. Treasuries, via TLT, show a gravestone doji pattern for last week, which to me says that TLT could retrace as far down as 119.10. First levels of support will probably be at 120.18, then 119.86. I will probably exit my puts at the first level of support, or get stopped out, depending on the price action on Monday.
I closed out some puts on Friday for about 25%, which is not much considering the move and where I bought and sold them. I went out too far on them, despite the really big move down. Had I bought next week’s weeklys, woulda done much better. Coulda shoulda woulda. lol
8:24 am PST Saturday. Never mind, I no longer need the arrays. I think I have a good sense of what the indices are likely to do on Monday and how I might trade it with my current positions. Just went over my charts and looked at the price action. Price action is king.
6:45 pm. Can someone please send me a snapshot of Martin Armstrong’s Dow arrays-monthly, weekly, and daily? Many thanks!
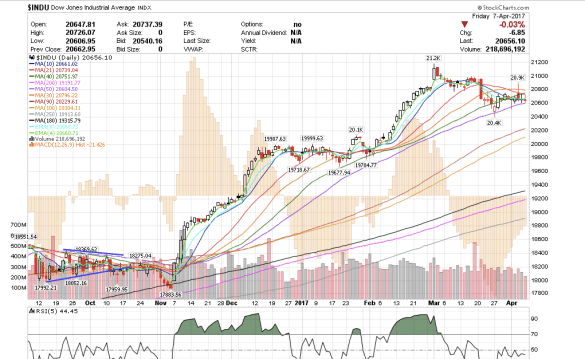
3:53 pm PST. I wanted to see a stronger close today than what we had as that would fit with my triangle wedge thesis. But the Dow closed below the 4 and the 8, which shows continued weakness. It has found support the past several days along the 50 sma, tagging it nearly four times already. If the 50 sma goes, I think we could drop again and test 20,229.
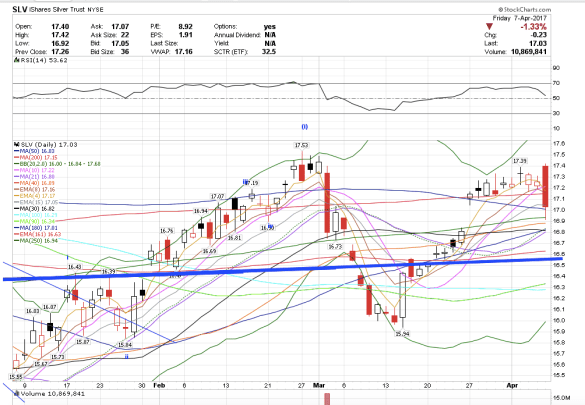
3:35 pm PST. SLV could pullback to 16.63. At least, that would be ideal for another long-side entry. It almost looks a though silver could have finished its retracement today, but MA’s benchmark cycle cautions me to wait a little longer.
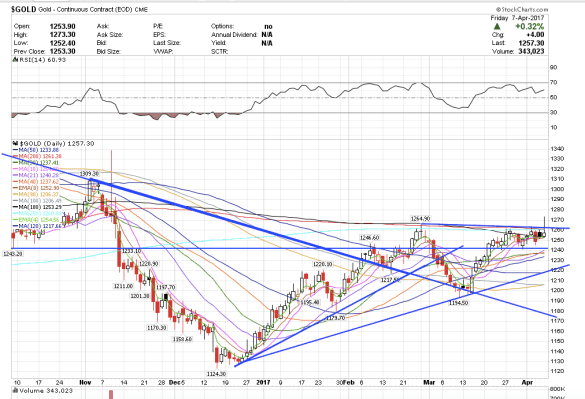
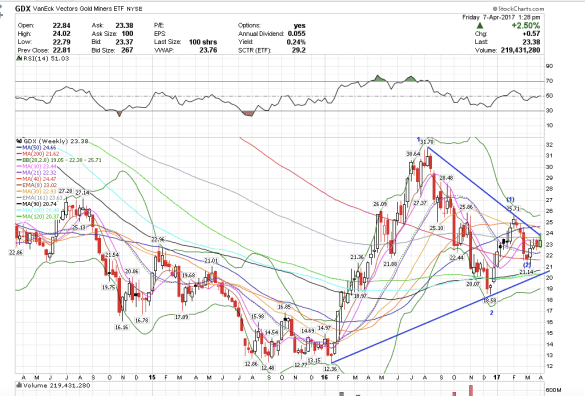
3:24 pm PST. Here’s my wave count for GLD. I am looking for a wave ii pullback to $118-117.50ish, for another long-side entry. I think it will be choppy until then because I expect a corrective wave, which are always choppy. Barrick Gold is coiling and coiling.
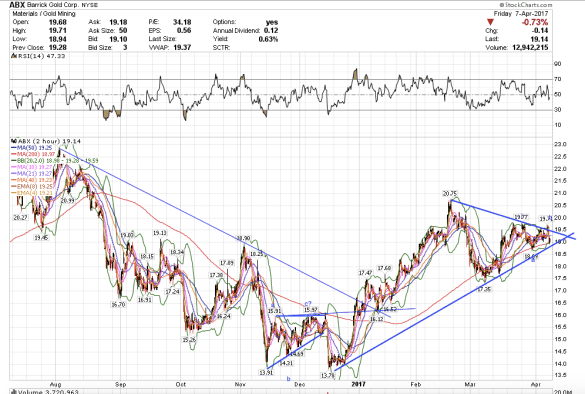
Barrick Gold in this nice triangle
GLD could pullback to $118-$117.50ish.

impulsive wave 1-2-(i)-(ii)-i-ii, gathering momentum
Gold needs to break and close above $1261 with conviction. It has tried four times now and failed. This is the key level for gold now going forward to move forward. The fifth try, however, might just push gold through this brick wall. All those sellers at the 200 sma will probably be gone by the fifth try and gold can fly higher. I see gold toggling back and forth between my key 1243 level and 1261. The 1243 level overlap showed gold would no longer break below $1000. Now gold has to push through 1261.
1:52 pm PST. I think I might change my strategy to shorter term intraday trading. I have been trying for longer time frames on options, but very challenging. I think the weeklys work better for day trading and 1 overnight swing trade. Stocks are better for longer term positions.
1:28 pm PST. I exited all my short positions in JDST and GDX puts.
1:05 pm PST. Very choppy day, but with quick finders, some traders did very well. Me, I needed more coffee. 🙂 TLT looks like it finally went sky diving.
10:29 am PST. GDX did a shooting star from under the upper trendline test.
9:57 am PST. This could be an ending wave 5 move for TLT, shooting star candle stick pattern. It gapped up and then could close below.
I saw a GOVT print at 25.13 for 2 million. If we close below, look out below for treasuries, and stocks could explode higher.
8:54 am PST. “Russian warship steaming toward US Navy Destroyers in Eastern Mediterranean.” I need a bunker.
8:40 am PST. “Atlanta Fed cutting their GDP Q1 to 0.6% from 1.2%”. Bad jobs numbers, a new war in Syria. I thought I also read that Russia no longer in communication with U.S. military.
