
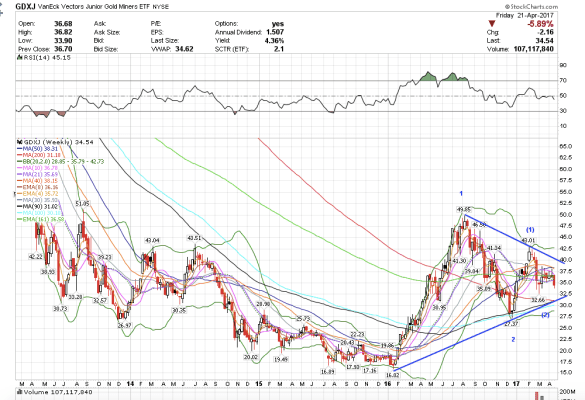
6:44 am PST. I expect GDXJ to drop to the bottom trendline on this wedge next week at around $31.50.
6:44 am PST. I expect GDXJ to drop to the bottom trendline on this wedge next week at around $31.50.
6:27 am PST. I am looking for a test and hold on SLV of one of either of the two bottom trendlines at 16.60 or 16.40. SLV is forming what I would call an “ascending triangle” pattern.


http://www.investopedia.com/university/charts/charts5.asp
The ascending triangle is a bullish pattern, which gives an indication that the price of the security is headed higher upon completion. The pattern is formed by two trendlines: a flat trendline being a point of resistance and an ascending trendline acting as a price support.
The price of the security moves between these trendlines until it eventually breaks out to the upside. This pattern will typically be preceded by an upward trend, which makes it a continuation pattern; however, it can be found during a downtrend.
 |
| Figure 2: Ascending triangle |
As seen above, the price moves to a high that faces resistance leading to a sell-off to a low. This follows another move higher, which tests the previous level of resistance. Upon failing to move past this level of resistance, the security again sells off – but to a higher low. This continues until the price moves above the level of resistance or the pattern fails.
The most telling part of this pattern is the ascending support line, which gives an indication that sellers are starting to leave the security. After the sellers are knocked out of the market, the buyers can take the price past the resistance level and resume the upward trend.
The pattern is complete upon breakout above the resistance level, but it can fall below the support line (thus breaking the pattern), so be careful when entering prior to breakout.
Read more: Analyzing Chart Patterns: Triangles http://www.investopedia.com/university/charts/charts5.asp#ixzz4ez7fo11E
Follow us: Investopedia on Facebook
6:12 am PST. I wanted to post this chart up of the IWM, which closed above the upper trendline after backtesting and bouncing. The IWM closed much more strongly than the DIA and SPY. The QQQ also closed with a bullish looking pattern. This provides some information of what the markets expects on Sunday/Monday.

1:02 pm PST. We had a decently bearish close on GDX that makes me bearish for Monday. Treasuries sold off into the close the way I wanted to see GLD sell off. SPY recovered reasonably well from its midday spike down. I would have like to see a more bullish close, but when looking at it in context, I remain bullish and have a target for 236.50 for Monday.
I saw an IAU print for 1.1 million at 12.37 and we closed right on it. The market really just closed on key levels not giving too much of a hint one way or the other before the French elections on Sunday. I saw a rare NEM print at 34.35 for 540,000, and we closed below, which suggests further bearishness for next week.
The Euro had a midday bounce as expected. It still looks somewhat bearish.
10:14 am PST. Gold spikes higher and SPY spikes lower. I am still bearish gold and bullish SPY. I know crazy. That is the final spike we needed to finally move lower. Gold will probably close below the 122.61 and sell into the close.

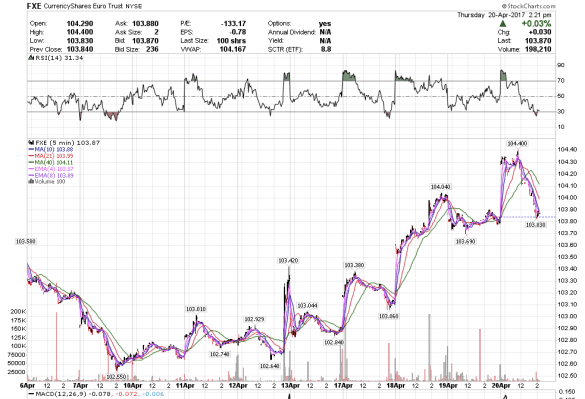
8:23 am PST. FXE continues downward as expected. I think we might see a bounce mid-today. If the Euro still looks bearish by the end of the day, maybe that means Le Pen might win, as her win would be bad for the Euro due to a possible FREXIT.

7:22 am PST. Buckle up. TLT is going down now. The wave b correction complete. Target 122, first, then 121.50 by next week. Gold to 1260. Watch out below. SPY just had about 11 million shares block traded at 235.11, real-time. Today is options expiration so I do not expect a huge, huge move today. But I expect to see the beginning of the move for next week.

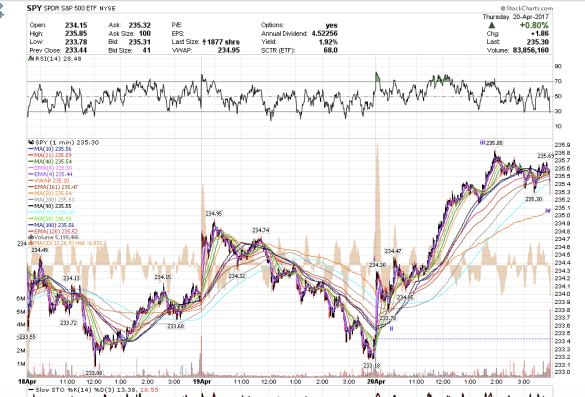
1:02 pm PST. Nice day for the U.S. indices. Here’s my short-term wave count for SPY. I think we have wave v left tomorrow at the open up into the upper trendline in the chart I posted previously, at which point I plan to exit my VXX puts.
I chickened out of some GDX lottery tickets expiring tomorrow. They were just in the money, but then GDX rallied up into the close and I just could not hold onto them. Now they will probably tank. Next time. I am still bearish on GLD and have some longer-term positions on that can withstand some short-term price movements. With the time decay on options, one has to have near impeccable timing on those that expire tomorrow. I might day trade it tomorrow if I see an opportunity.
11:22 am PST. The FXE is tanking now. A small bounce tomorrow, and then tank next week when Le Pen loses. Bye, bye Euro, it was fun while it lasted.
10:29 am PST. SPY will probably go for the upper trendline before it pulls back. Still in VXX puts, which are stalling a bit because VIX is still in backwardation as I think traders do not trust this rally, lol. SPY calls are better than VXX puts right now as a result.

