
The Japanese Yen and Gold clearly have a close correlation in price movements. If the Japanese Yen drops to new lows, that will spell a steep sell-off for gold as well. I do not, however think the Yen is a leading indicator for gold. If you look at the 2011 high in gold and the Yen, you see that gold peaked before the Yen. Gold may be a leading indicator for the Yen. Also, to me, the Yen has a more bearish chart pattern than gold. The Yen could also make a new low while gold makes a higher low.
Just doing EW analysis, I do see some possibility of the Yen dropping to new lows at around $75-74, but not right away. There is a whole lot of support right now before that happens. If the Yen intends to drop to new lows, prices would most likely triangle into a wedge for several month, possibly into August, before dropping down to new lows. That would most probably correspond with a rally starting in August in the Dow.
Likewise, I think Gold must exceed $1300 to really see some sustained upside movement. If gold fails to exceed $1300 by June/July, gold could see trouble ahead.
In this chart you see the FXY, yen etf, juxtaposed with GLD in black.
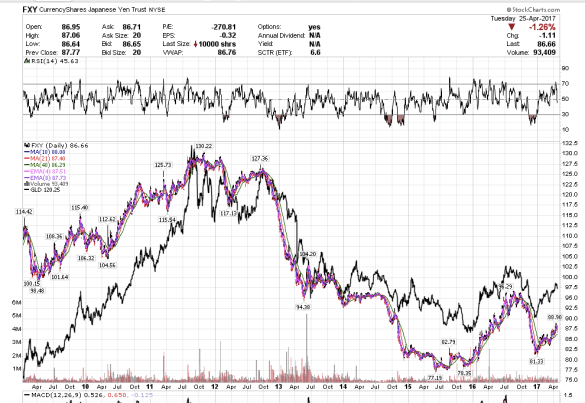
FXY correlated with GLD in black.
FXY has already broken down from a rising trendline. If prices cannot exceed the high at 88.90 by June, I would say just by my own EW analysis, gold and the Yen might see new lows.
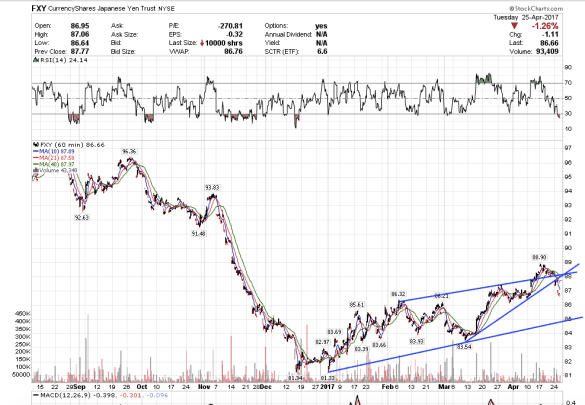
FXY on a shorter 60-min time frame.
