Pi Calculation

The Dow and SPX bottomed in March 9, 2009. Adding 8.6 years brings us to about the third week of September. SPX bottoming at 666, exactly. Amazing how biblical. A lot of 3’s in that number 666, 3.9.2009.

2009.20 bottom, + 8.6 years = 2017.80. 12 x .80 = 9.6, which looks like about the third week of September. Someone please correct me if I am wrong.

666 x 3.62 = 2410.92, a fibonacci ratio. Just an interesting observation.

The next ECM turn date is November 2017.

Closing Thoughts

1:03 pm PST. Really strong close on the SPY today. It broke above the top trendline confirming that the correction was over. Going into the weekend I have SPY calls, long FAS, short VXX, and have a few AAPL calls. Target SPY is 236 at least, possibly 237. I stopped out of FB.

The miners continued selling off into the close. I am looking for 39.50 on GDXJ next week.

Have a great weekend!

screen-shot-2017-02-17-at-1-01-29-pm

SPY

8:51 am PST. This is what I think is happening on the SPY now. It looks like a-b-c-d-e done. Has to break above the upper trendline to confirm. I covered GDXJ +.52, GDX +.32. Will look to re-enter.

screen-shot-2017-02-17-at-8-51-25-am

Trade Updates

7:45 am PST. I shorted GDXJ from 42.24, target $39 by end of Feb. Shorted VXX, bought AAPL calls and FB. Long FAS, all this morning. I think my thesis might just play out.

screen-shot-2017-02-17-at-7-44-49-am

Bank of America and Goldman Sachs look done on the downside.

screen-shot-2017-02-17-at-7-53-52-amscreen-shot-2017-02-17-at-7-54-15-am

Pre-market

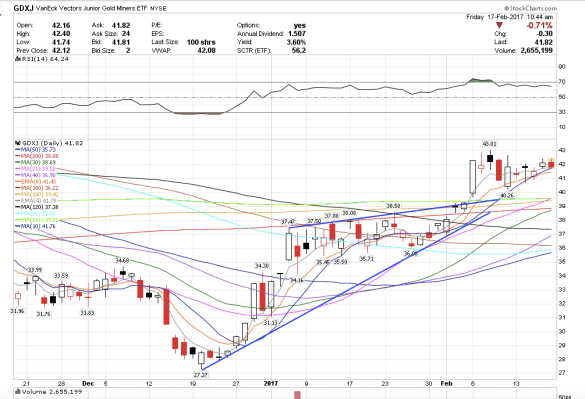
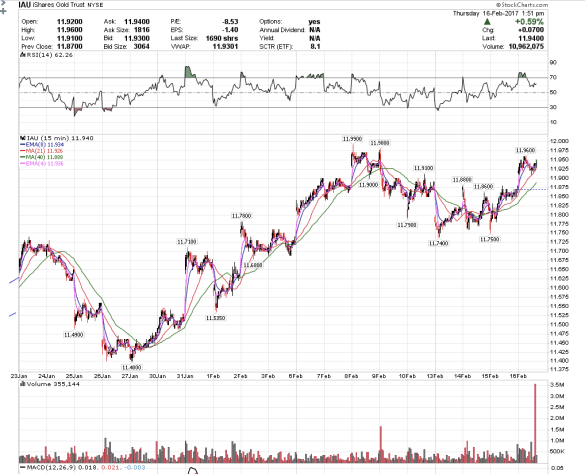
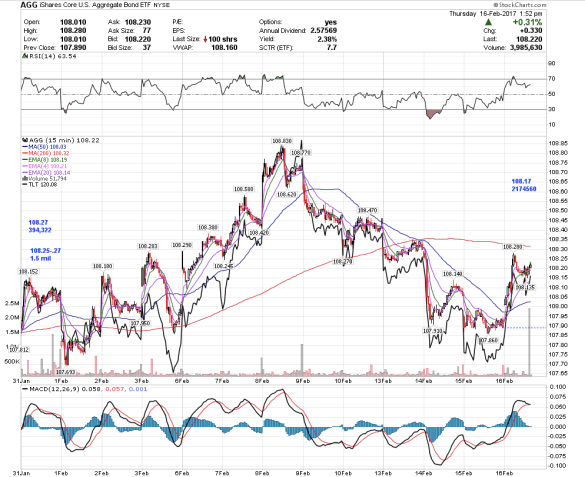
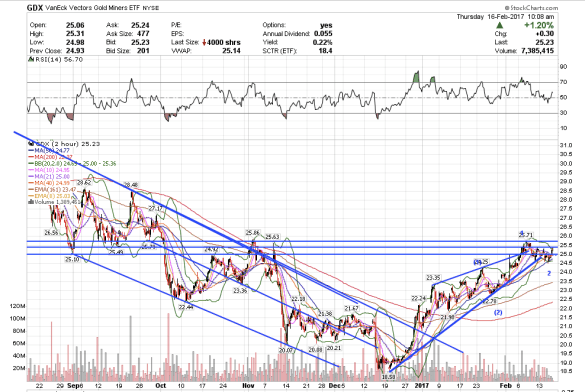
2:48 am PST. Yes, I do watch and trade the market during the wee hours of the morning in California. Lol. If you are in the east coast, its probably just regular morning hours, but you are lucky that I am up now. 🙂 This is when I think best. Now I think I understand what is happening. Gold and bonds are going up because the SPY still needed to do its wave c-d-e, which I had mentioned, but then seemed to forget at the close yesterday when I got preoccupied with the AGG prints. Yes, the market makers were indeed buying gold and bonds. Good thing I came to my senses and turned around and bought gold, lol. But it is an ending wave v in gold. I stopped out of my TLT this morning.

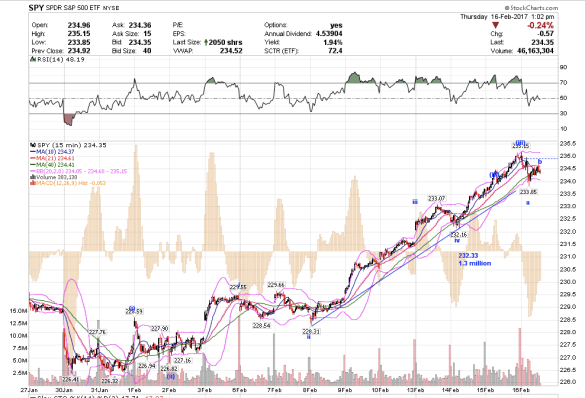
What I see is that the SPX will go up to new highs in an final ending wave to end the Major wave 3 up from 2009 by next week as gold makes a minor retrace. Then the indices will likely correct for 3-7 months as gold rockets higher in its wave 3. After the market finishes its Major wave 4 correction, gold will correct again.

screen-shot-2017-02-17-at-2-41-51-am

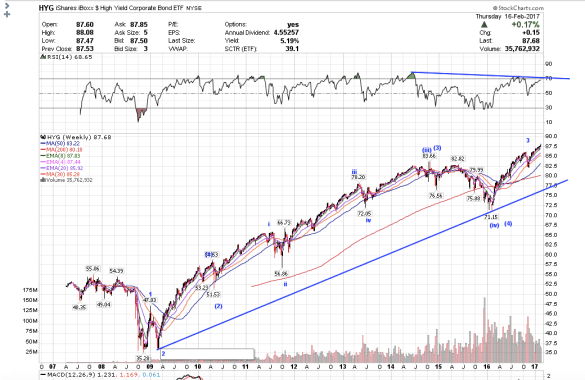
The HYG, corporate bond etf, tracks the DOW very closely. It is a slower moving vehicle than the indices, but has basically the same trend. It looks to be topping by the end of February in major wave 3 up since 2009.

screen-shot-2017-02-17-at-2-42-15-am

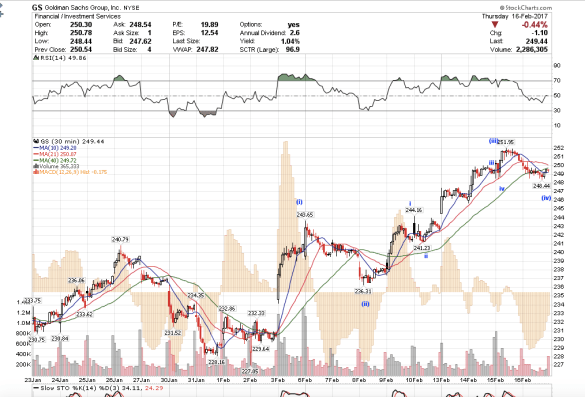
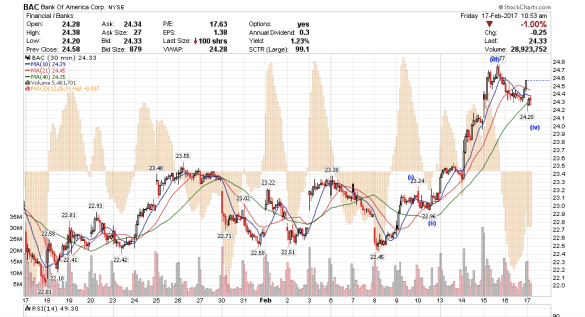
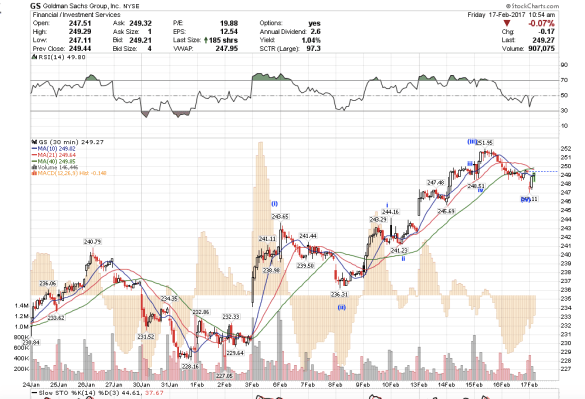
The Goldman Sachs wave counts also confirm that there is only a minute wave (v) higher, which looks like it will probably end next week. Wave (i) took three days. Wave (iii) took five days, and so wave (v) will take less than a week to complete which brings us to next week. Once wave (v) completes that will probably mark the end of Major wave 3 in the indices, at least that is my thesis.

screen-shot-2017-02-17-at-2-42-48-am

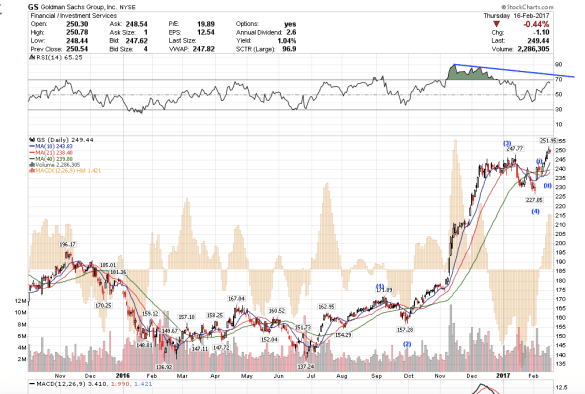
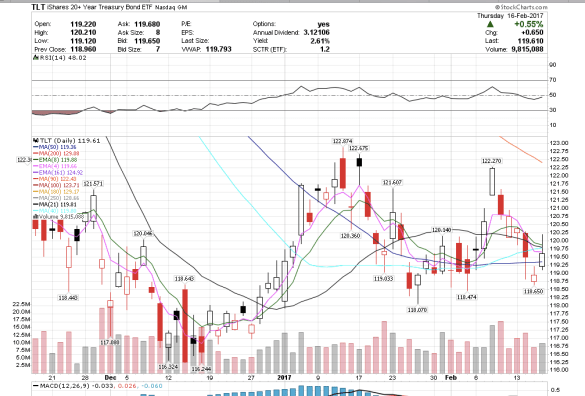
This is a look at the Daily chart and the RSI confirms a topping process right now.

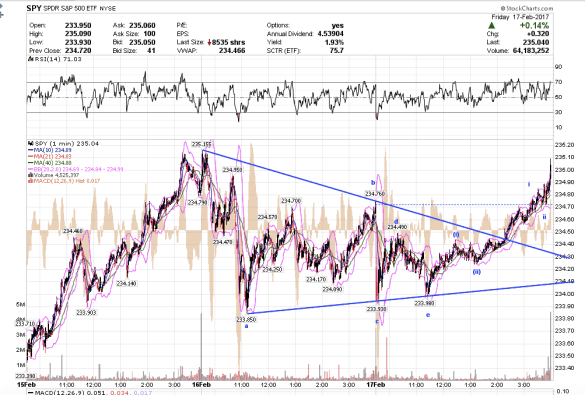
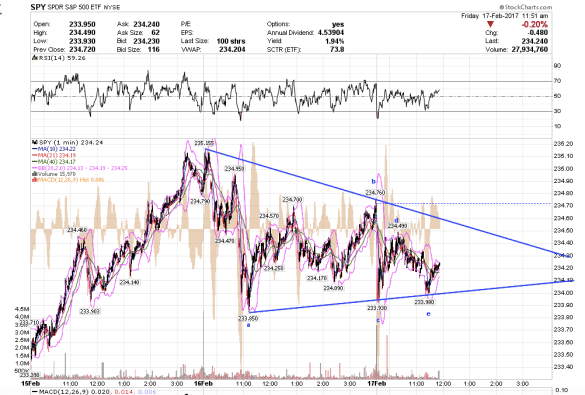
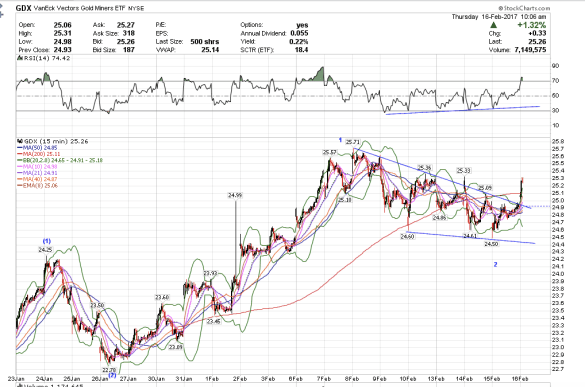
This morning’s low in the SPY for the completion of minute wave (iv), and is a buy for me for one more ending minute wave (v). Simultaneously, the miners are a sell in an ending wave up.

Closing thoughts

3:16 pm PST. I changed my mind and bought some select mining stocks after market, and after looking at individual charts.

1:13 pm PST. I took profits on JNUG +.50 and shorted TLT because we closed below the AGG prints and under the 4/8 emas on higher volume. IAU closed above the 11.92 print, and above the 4/8 ema, but I am not sure about it so I just took profits. I can always get back in tomorrow if it looks bullish again.

It looks like it might be the kiss of death for bonds.

screen-shot-2017-02-16-at-1-10-18-pm


ABEV

11:36 am PST. Speaking of ABEV from yesterday, interesting dark pool prints today at 5.80, 950,000 shares block traded. I think it is buying, imho.

screen-shot-2017-02-16-at-11-36-24-am

Bonds and Gold


1d274906790991-today-goldfinger-140915-01-today-inline-large

10.53 am PST. Lol. Big IAU and AGG prints just moments ago. The market makers in the dark pool look like they are buying bonds and gold.

IAU 2,865,285 shares at 11.92, bullish above, bearish below. I have not seen this for weeks!

AGG, 2,174,560 shares at 108.17. Bullish above, bearish below.

Or it could be the kiss of death from Mr. Goldfinger. Careful, all he loves is gold. 🙂

screen-shot-2017-02-16-at-10-52-04-amscreen-shot-2017-02-16-at-10-52-32-am

GDX

7:09 am PST. Here’s my GDX count. It is in an area of congestion that it would have to rally above and hold. Once it does that ought to become a wall of support at 25.80.

screen-shot-2017-02-16-at-7-06-55-amscreen-shot-2017-02-16-at-7-08-53-am