5:22 am PST. I am out of my mining stocks. Gold looking bearish.
4:53 am PST. I have two wave counts for gold as of this morning and I am not sure which one is right. The first count have is that gold has completed a (1)-(2), 1-2 wave up and the next wave up that unfolds is major wave 3 up which would be a sustained rally. In this count gold would only make a shallow 3-day retracement, which it is has done, and the next move would be marching higher. However, this count I am not sure about because first, the dollar certainly looks to be headed towards new highs which typically would cause gold to drop. I would expect in this case for gold to make a higher low while the dollar makes a new high. Secondly, some of the mining stocks have negative divergence going into this new high, but interestingly gold does not on the daily chart, which is what I would typically expect if gold were to make a deeper retracement.
My second count is on my 1-hour chart. Interesting how gold hovers above the downtrend line in the 1-hour chart. This count shows that gold has only completed wave (1) up, which would say that the next move for gold is a continuing correction to perhaps 1200 or perhaps 1180 that would take another week or two. This seems to coordinate better with the dollar rally.
I have longs but in a smaller position. I do have my finger on the sell button if things should turn sour. I watch the miners tick by tick and if they do not do exactly what I expect, I have a very tight stop and I will exit in a hurry.
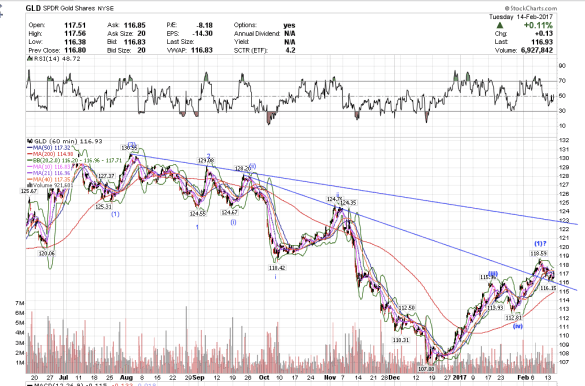
Gold hovers above downtrend line. This is my second alternate count, showing gold could retrace to 1200 or 1180 in 1-2 weeks.
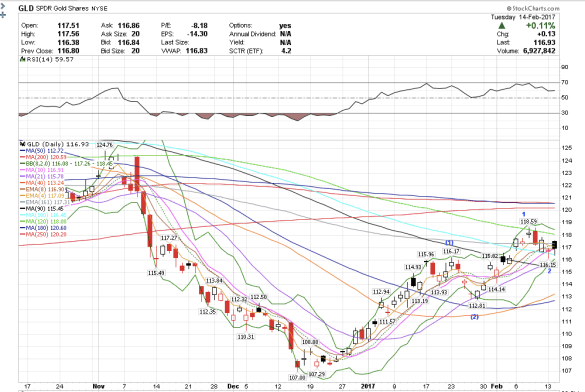
This is my first wave count.
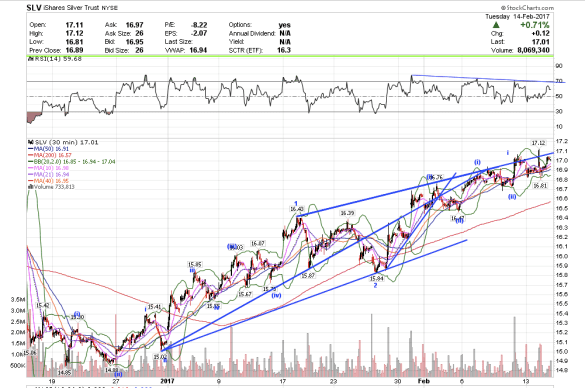
Silver really has to break out of this channel to signal my first wave count is in play. But it is negatively diverging and might just breakdown signaling my second wave count is in play.