
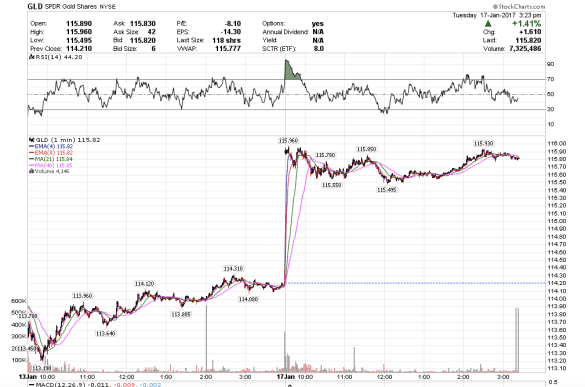
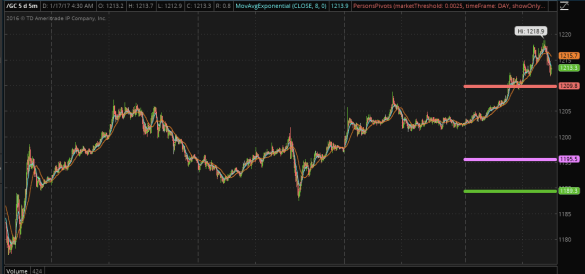
12:25 pm PST. Two block trades came in on GLD just moments ago at 115.84 totaling 1.8 million shares. Bullish if we close above, bearish below.
12:25 pm PST. Two block trades came in on GLD just moments ago at 115.84 totaling 1.8 million shares. Bullish if we close above, bearish below.
12:02 am. stopped VXX short. -.05. Stopped out remainder of QQQ and SPY calls for loss. Until the TLT finishes rallying, the indices are going to have a hard time moving up. Overall a good day on the mining stocks.
11:49 am. PST. re-shorted VXX but with a smaller position.
11:37 am. PST. Stopped out VXX short, covered for +.20. Will look to re-enter. GDX has one more high in the works as well as TLT, which means SPY and UUP one more low.
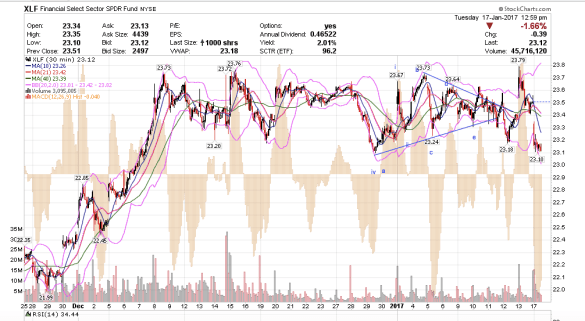
10:05 am PST. XLF’s rally to 23.79 was a really short wave v. I think XLF probably has to tag $23-22.90 to complete another wave iv of some degree. I do not think the rally is over, and I think we will see new highs in XLF after this retrace.
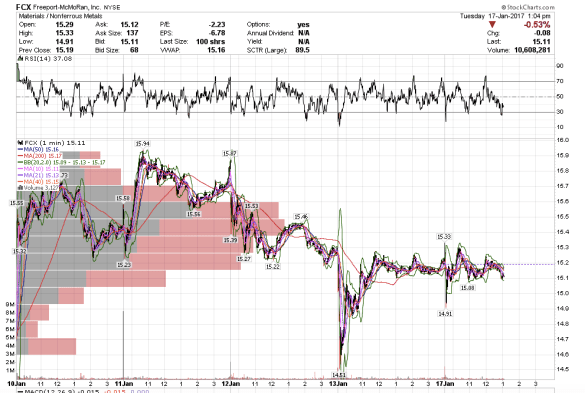
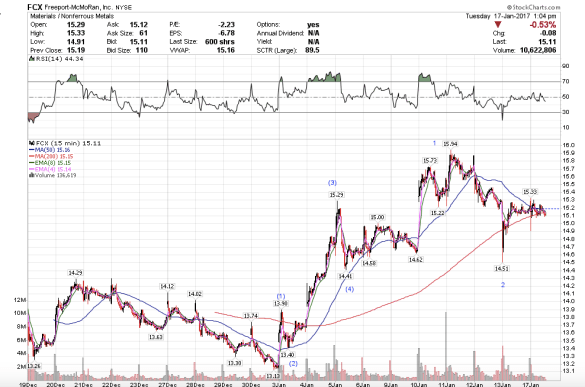
I stopped out of FCX for break even. Goldman Sachs is lined up to buy FCX at 14.75 and I wonder if we might just go there. Everything is trading in a really tight range this lunch hour.
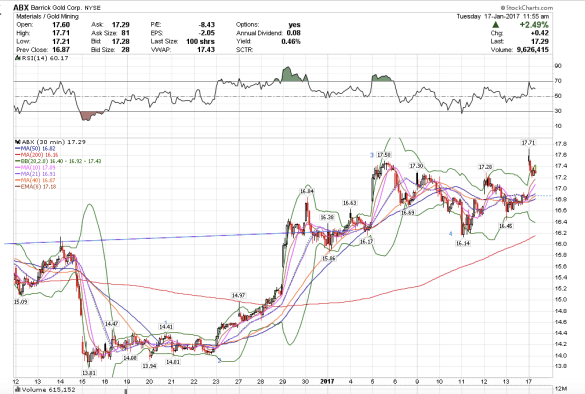
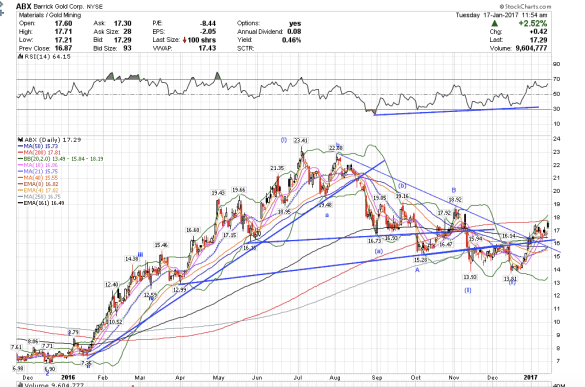
8:59 am PST. ABX is finding resistance at the 200 sma and has made a higher high on negative divergence. The wave count suggests this is indeed an ending wave v. We had a 1,469,700 share block trade on GDX at 23.20, which we are above now, indicating the miners could make one more small fractal wave higher today or by tomorrow before topping out short-term. I think ABX will retrace back to the 21-sma on the day chart which might take until next week to about $15.75-$16. I would give the retrace about three to five days. After it does, then I will see how it goes regarding buying into a longer-term position.
The retrace in gold and mining stocks will help pull bonds down and give the indices the needed energy to rallied to new highs. For this trade, I decided to switch out of IWM and FAS, and short more VXX instead.
7:18 am PST.
I closed out my mining stocks +.41 AG, +.60 & .90 Jnug, +.39 GG. I bought IWM, SPY calls, and I am still long 1/4 position QQQ from last week. I think this morning’s pull back on the indices is a great opportunity to buy as I believe they will make new highs this week. I also bought FCX and shorted the VXX.
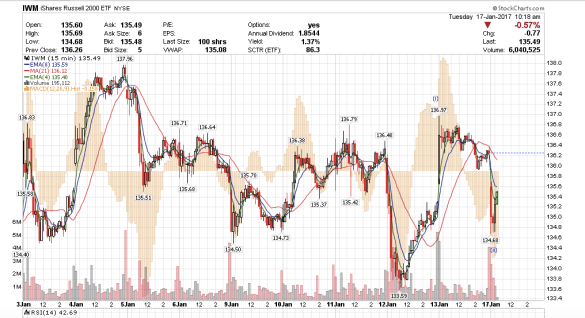
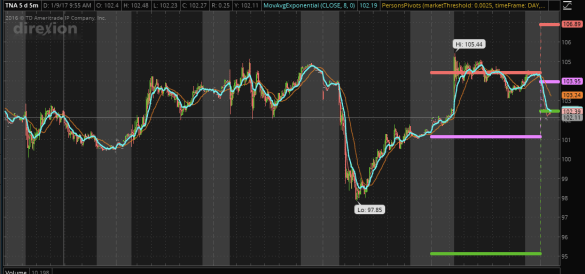
Here’s my 15-min-fractal-wave count on the IWM.
4:33 am pst. We are lucky to have a retrace this morning on the indices. I plan to be scaling out of my gold mining stocks and buying into the Russell and financials this morning on this dip.
Comparing the high-yield corporate bond etf HYG to the SPY shows a very similar price pattern which is bullish for HYG. However the SPY is up nearly quadruple since the 2009 lows compared to HYG which is up less than three percent. SPY has yielded a better return over the same period.
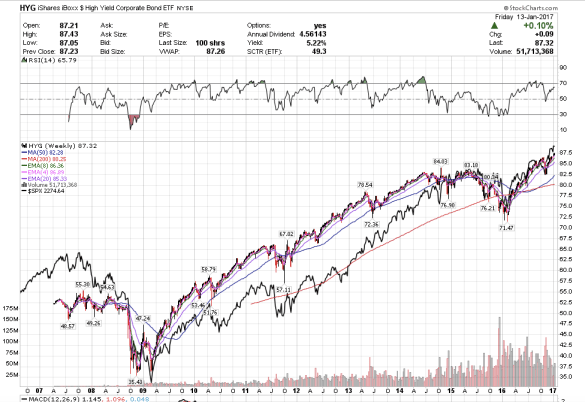
HYG v. SPY
Even better has been shorting the VXX.
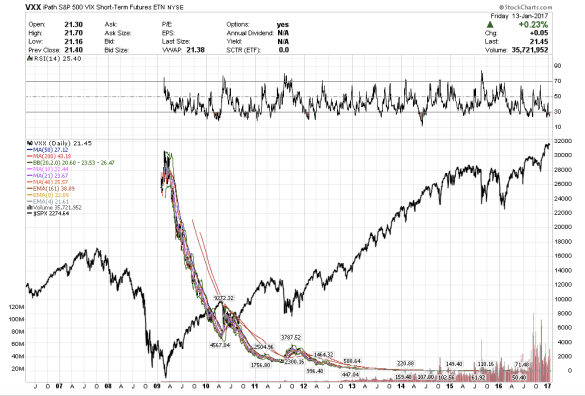
VXX v. SPY
I wanted to look at the correlation between the Yen, the Nikkei index, the dollar, and gold and post the charts. Whoa. It looks as though the Nikkei is on route to making new multi-year highs as the Yen is poised to breakdown to new lows.
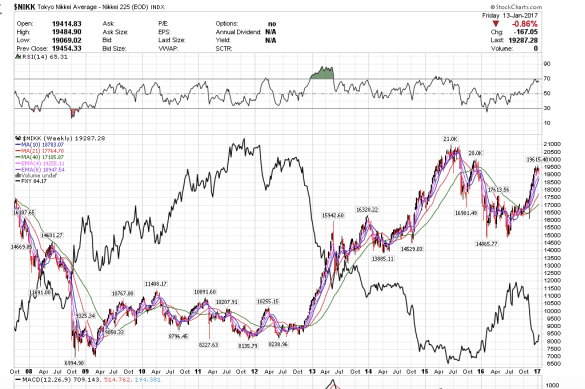
Nikkei compared to Yen etf FXY
Here is the Japanese Yen etf FXY compared to the US Dollar etf UUP. They look inversely correlated, but not exactly and not proportionately. The Dollar and the Yen both declined together the second half of 2013.
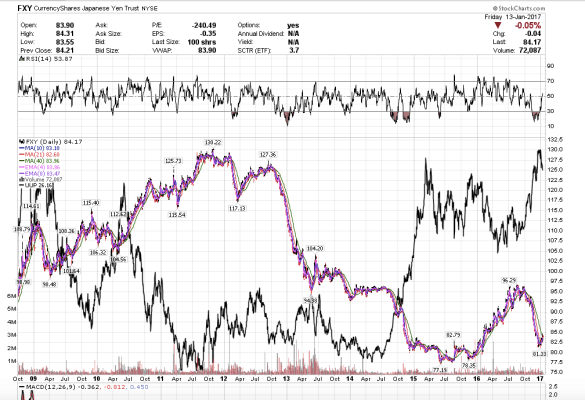
The FXY compared to the USD ETF UUP
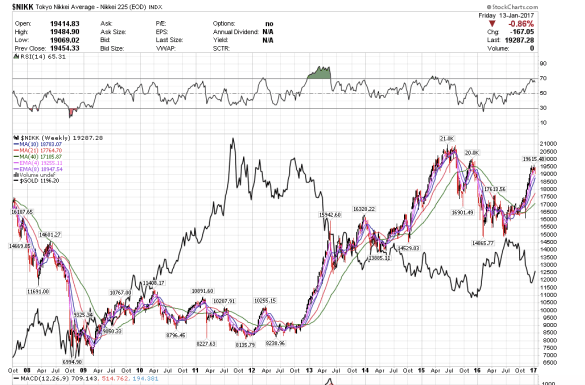
Nikkei compared to $Gold
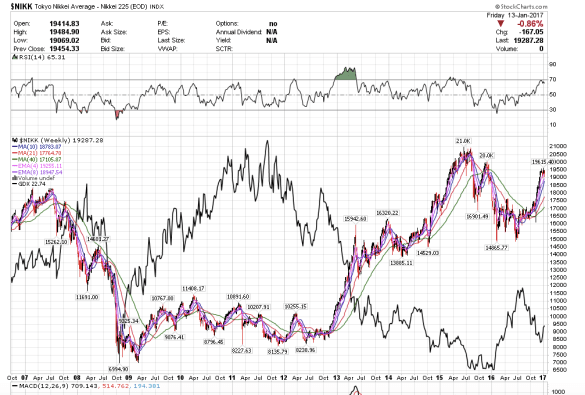
Nikkei compared to GDX
The correlations between the Nikkei index compared to gold are almost inversely related. I would not say perfectly inversely correlated because from 2009 to the first quarter of 2010 both gold and the Nikkei rallied together. It appears the Nikkei index bottomed after gold bottomed in 2009 and topped out before gold bottomed in 2015. Will gold bottom before the Nikkei tops out or after this time?
It does look to me like the Nikkei is going to make new highs this year. Looking at the last 10 years of correlated performance between the Nikkei, Yen, Dollar, and gold, it appears that the Yen and gold might have further to fall as the Nikkei and dollar rise to new highs. I can see, if everything is connected, how some traders are still skeptical about the gold rally. I do know of one fairly well known trader who is bullish on the Nikkei and just turned bullish again on the gold mining stocks. It is just something interesting for me to think about.
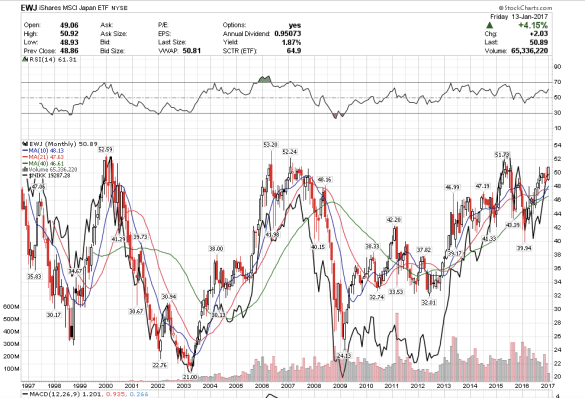
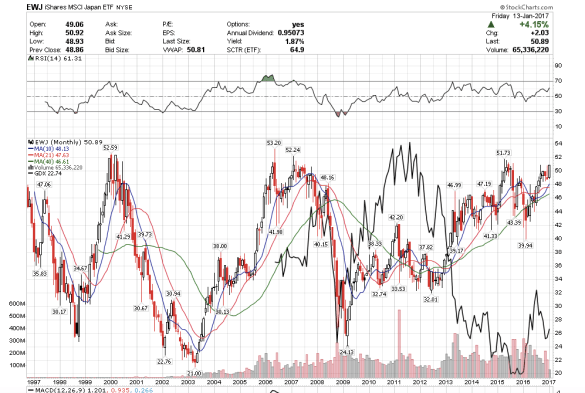
EWJ compared to $Nikkei
The EWJ is little more forgiving than the Nikkei.
EWJ compared to GDX
EWJ and GDX both rallied together from 2009 to 20011 and declined together from 2001 to 2012. In 2012, they were inversely correlated from 2013 to 2015. Something happened in global capital flows that caused the Nikkei to continue to rise while gold fell – Abenomics was good for the Nikkei and the dollar, but not gold. Confidence shifted to the dollar.
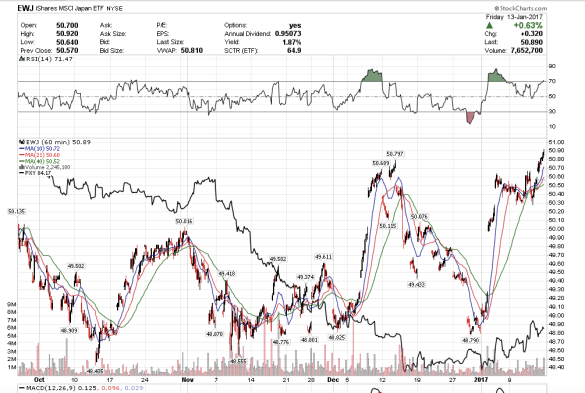
The EWJ is becoming overbought short term.
EWJ compared to FXY
I am not sure I see a good correlation either way for EWJ: FXY.
We had 208,000 shares of AUY traded at 3.16 and we closed above. We closed above the GLD prints at $114. We also had 100,000 shares of NUGT traded at 9.64 and we close above. We also had about 210,000 shares of IAU traded at 11.51-52 and we closed above. Closing above all these prints would normally be bullish.
The only thing is that we also had about 280,000 shares of SLV traded at 15.95 and we closed below. NUGT closed above the 4/8 ema which is positive and I like how the pattern is setting up too for a lot of the miners. I remain a bull into Tuesday.
The Dow made another attempt at 20,000 but sold off as bonds caught a bid into the close. The Russell and financials also popped higher this morning but drifted lower as traders took profits.
It looked as though the U.S. dollar would rally and continue, but sellers came in and sold it off into the close. UUP closed -.11%.
Have a wonderful weekend!
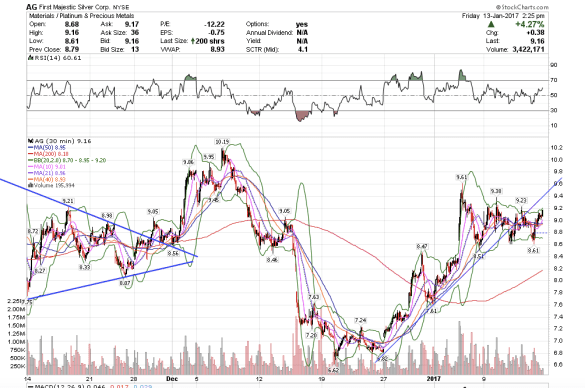
11:27 am. AG looks like it is going to be a runaway train. I am on this train now as long as long as GLD closes above $114. If we close below, I am hopping off and running in the other direction. 🙂

Try getting on a plane with that. lol. Do you think I can get past customs?
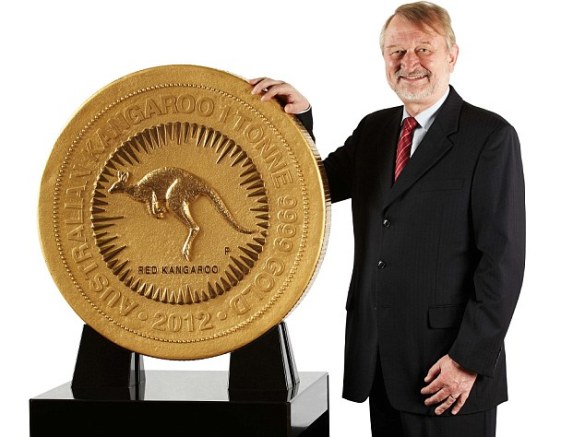
Enter a caption
Perth Mint Chief Executive Officer Ed Harbuz with the one tonne, 99.99 per cent pure gold coin
