
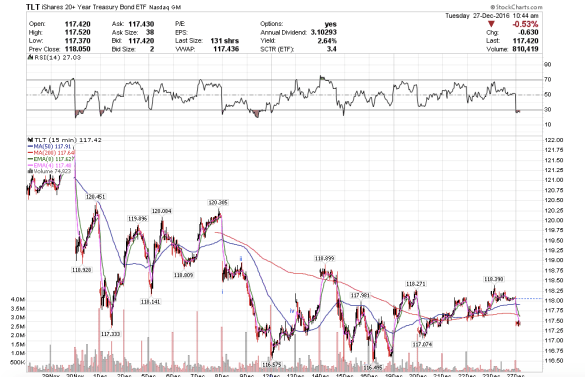
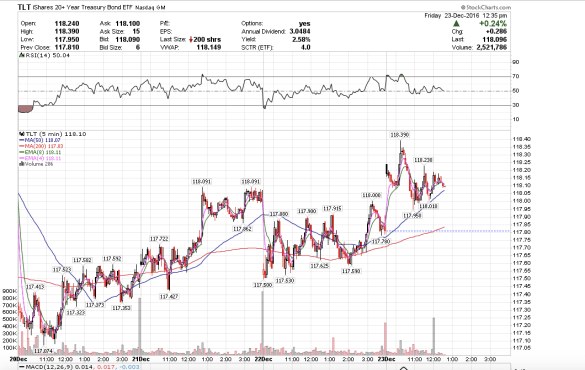
I shorted TLT with a $116 downside target.
I shorted TLT with a $116 downside target.
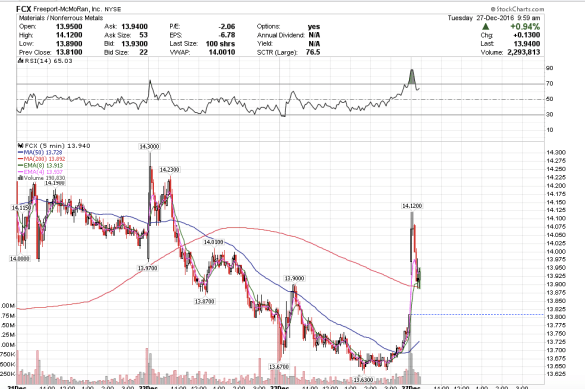
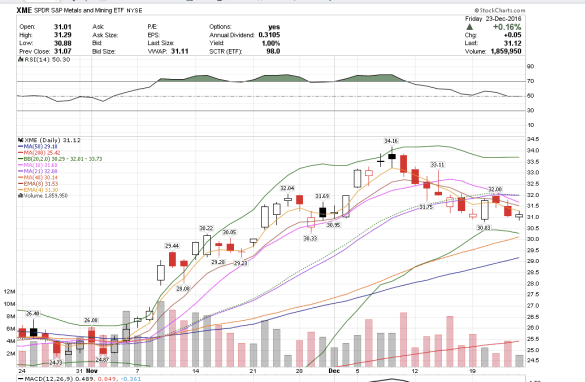
Scaled out FCX for +.15 and exited XME for +.20. The mining stocks are still risky so I am taking gains where I can. I want to see if this morning’s gap up can hold before venturing in again.

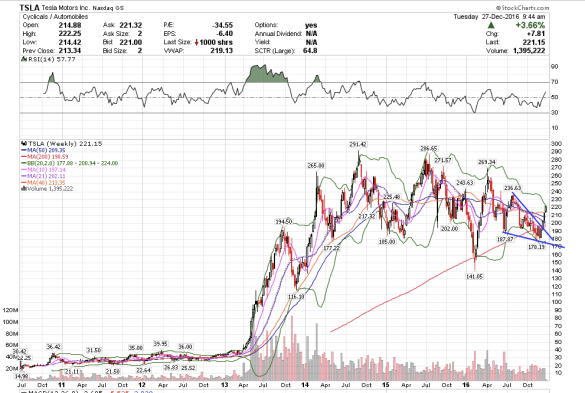
TSLA is going to $300+. It broke up out of its bullish descending wedge consolidation. I bought a little today and I am going to hold on. I love this car.
My eyes are on /GC this morning. There was a high volume upthrust at 1151.7. /GC is up with the dollar slightly higher and TLT down this morning. /GC has support at 1142.
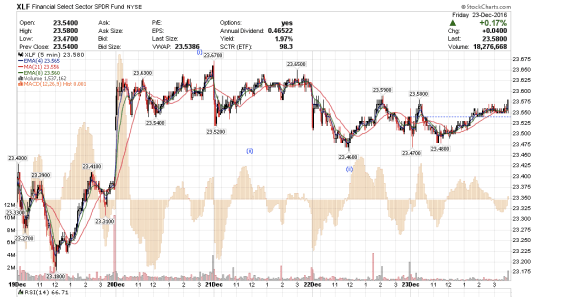
 XLF is also slightly up this morning marking the start of a new wave higher.
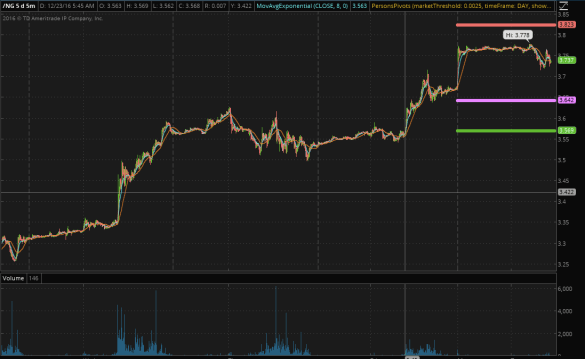
I am also watching /NG which looks to be consolidating to move up. I am looking at a possible move to 3.823.
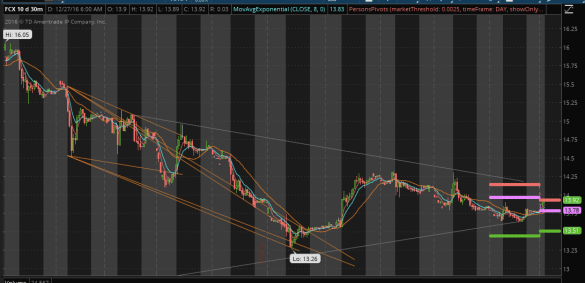
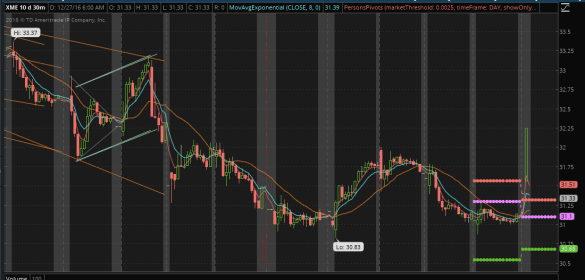
Also watching my two current positions in FCX and XME. FCX for a break and hold above 13.92, and XME for a break and hold above 31.33.
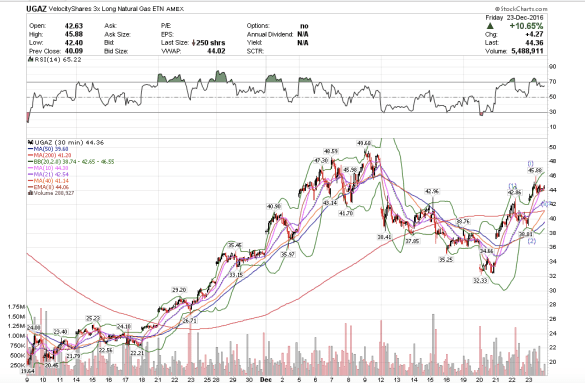
Nat gas is crazy on fire. Why is it going up so much so quickly? Global cooling? I do not usually trade fundamentals. Fundamentals trading is voodoo. Whatever the fundamental reason…am I the only one seeing this huge rally potential?
I just told myself this week I was going to focus on trading less, trading fewer instruments, simplifying my trades, holding my positions for longer and using less margin. With Nat Gas, I can see the bullish potential, but I have been only really short-term scalping this trade with UGAZ. How do I hold onto this stock when every time I buy it I start feeling like it is going to sell off? I want to trade it, but every time I own UGAZ I feel like it is a hot potato and I have to exit fast.
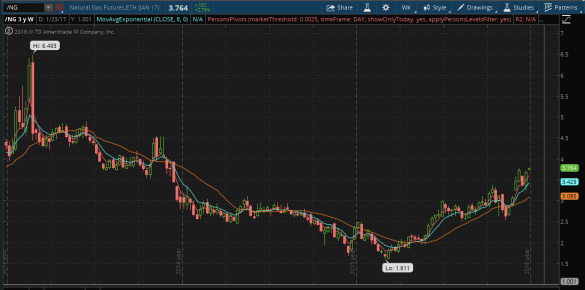
This is my uber-bullish count for UGAZ.
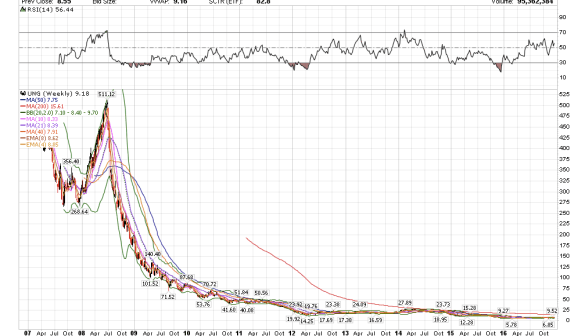
This chart is the reason why I only scalp UGAZ. Is this a multi-year rounded bottom? How long can natural gas prices stay this low? What is cheap can always get cheaper, but nat gas is going up for now.
I believe that if you want to make the world a better place you have to make yourself a better and happier person. Whatever is going on in the world, I do not believe I can change anyone else or the behavior of anyone else. I choose not to focus on the bad news anymore and in fact tend to avoid the news at all costs these days. It is ironic because I used to be journalist and a news generator, lol. The past is the past and I certainly believe that I can change myself, make myself happier, take care of myself, allow myself to think positive thoughts, and to have a positive outlook on life. I choose to focus on the good things in life and there are a lot of good things I have in my life and feel thankful for. I have gratitude for all the good things in my life, and writing this blog makes me feel happy and thankful. Feeling happy and thankful in and of itself is a great reward.
Having and generating wealth is one component to taking care of myself. Who wants to be poor? There is everything good in the attempt to create wealth legally and ethically. And for me money represents freedom. What does money represent for you? I learned recently that my hidden purpose in life is freedom. The way that I can find freedom is through discipline – discipline in my personal life, discipline in my trading, and discipline in what I think, say, and do.
The mining stocks during the first half of this year served my purpose of wealth generation very well. They moved quickly and they moved a lot. But since July they have been more of wealth destroyers if one was long, and one of wealth creation if one was short. I do have to say that I traded the first half of this year with the mining stocks supremely well, and well, the latter half, I certainly could have done a lot better. I am still up for the year, but yes, I have learned quite a lot about needing to change directions! 🙂
Okay, so with that cautionary note in mind, here is my mining stocks shopping list that I wanted to take a look at: (and please remember my blog is for educational purposes only):
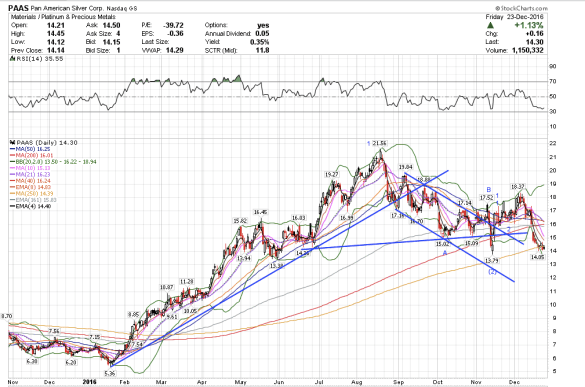
Starting with my favorite mining stock, PAAS. As gold and silver continued to sell off to new lows, this stock rallied up above its neckline break and is still trading above its November low. The pattern looks very corrective. PAAS could go to $13 to complete the corrective wave down, and if and when it does, I will want to buy this stock. Or it may have already bottomed. It looks like it is backtesting the upper trendline. I do not need to be the first one in to buy the next bull market. There will be plenty of upside and opportunities to buy in if indeed the next great bull market in mining stocks is around the corner.
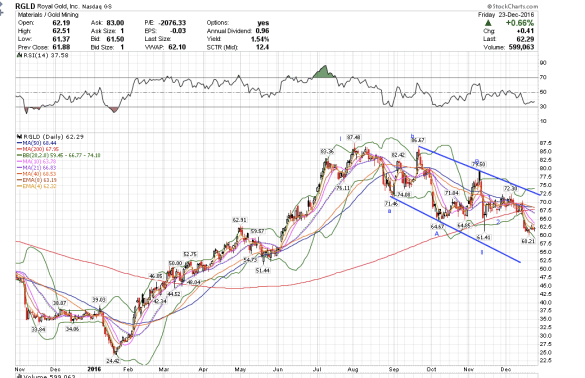
Royal Gold, RGLD, also is trading within its bullish corrective channel. I like RGLD.
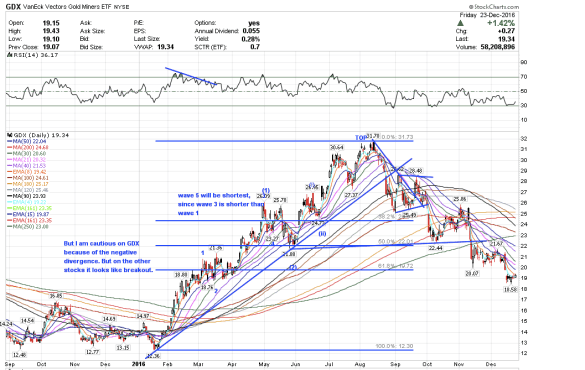
The GDX chart looks a lot like silver. It too looks corrective.
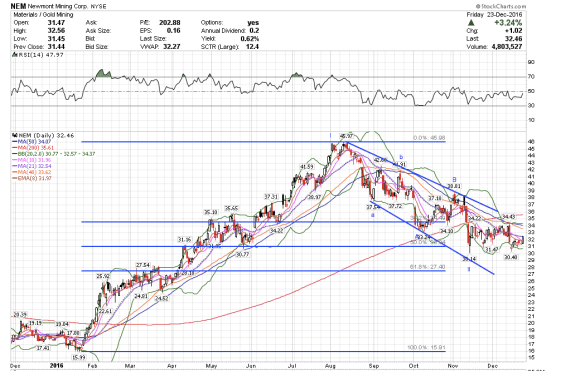
Newmont mining, NEM, also looks like it is in a bullish corrective channel and ready to rally. Friday’s rally certainly helped the bull case. I wonder if it might already be a buy. I might have already bought into this stock if it were not for the gold chart. And so I stand by and watch for now. I watch closely.
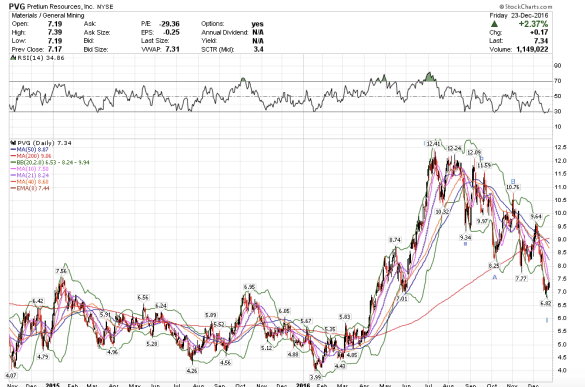
Pretium Resources, PVG, shows a classic bullish corrective pattern. This pattern is really common and you can see this same exact pattern on so many different time frames. This fact that these mining stocks show this pattern is why I am bullish on gold mining stocks for the long term. To be fair, I do sometimes see this pattern at the start of a massive bear market, but in this case, I think this is corrective considering that gold has already fallen so much. One always has to look at the pattern in context with how the underlying commodity has performed.
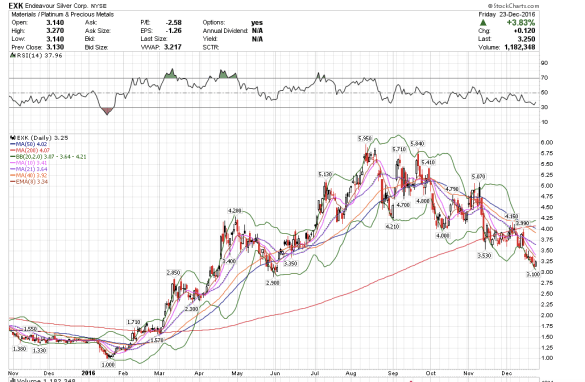
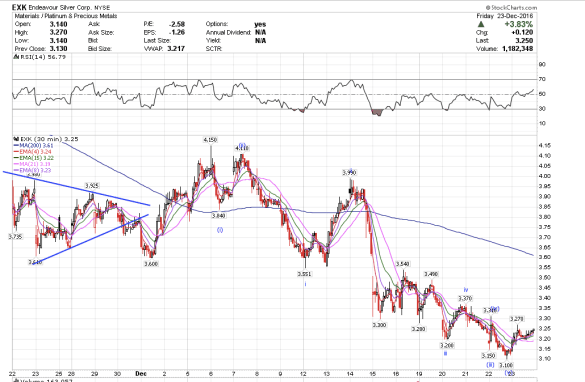
Endeavor Silver also looks like it might have bottomed or is bottoming.
Look at this huge bullish descending wedge on Kinross Gold, KGC. We just bounced off the bottom trendline.

I feel happy to be back at home and at my desk. I love waking up early in the morning when everything is quiet to think about the day ahead. Today I thought I would attempt a review of the various markets to prepare for this week trading.
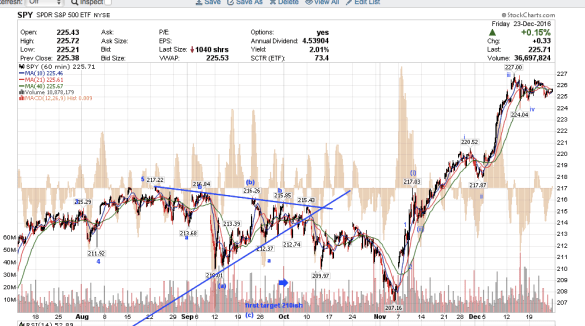
Here is my chart for SPY. It appears last week the indices took a breather and consolidated sideways really nicely. I think we still have more upside into the new year.
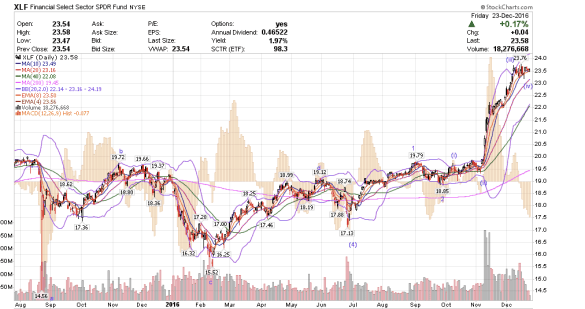
I like to compare the XLF chart side-by-side with the indices to make sure I have my count correct. XLF is still in bull mode. XLF could possibly go as high as maybe $29 by mid-next year. It would take some time. If XLF can go there, the indices would rally together.
The dollar ETF UUP still looks bullish. I see a continuation of the bullish trend and short-term move up to $27 into the new year.

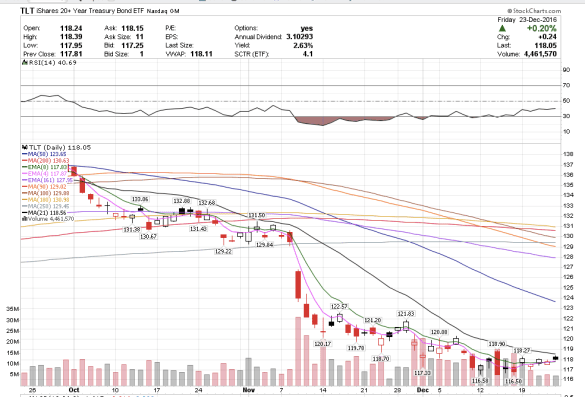
The 20-year treasury bond etf TLT will likely find resistance at the 21-sma day chart at 118.56. I think sellers will take the bonds down again into the new year and beyond.
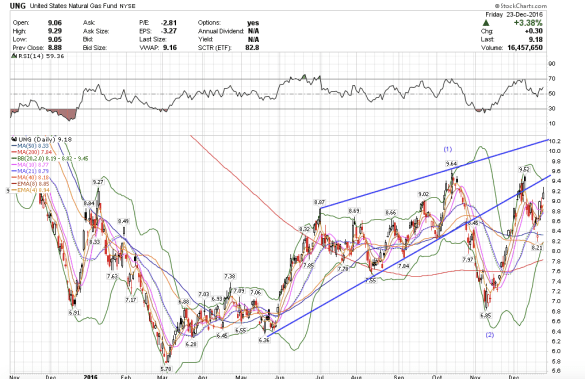
Natural gas has been really moving well lately. I wonder if UNG might rally up to the 200 sma weekly chart eventually at $15.61.
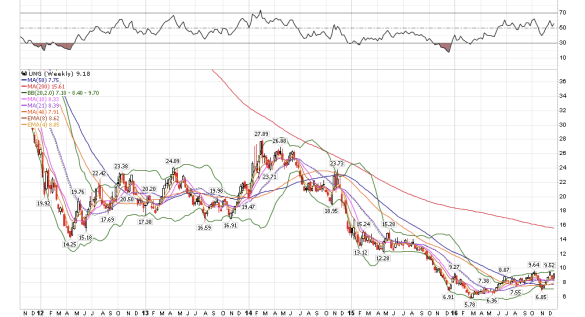
Shorter term, I still think UNG could go to 10.20. I plan to watch UNG/UGAZ closely.
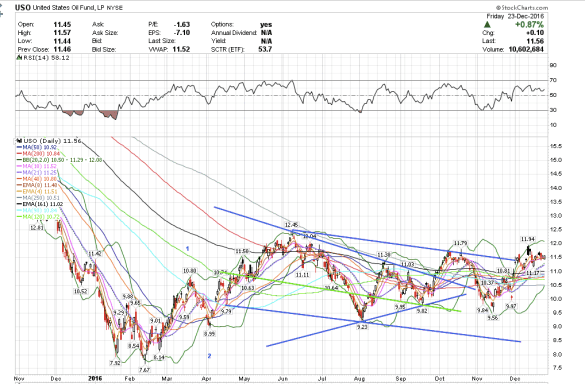
Oil’s etf USO closed bullishly last Friday. It is also now above the corrective channel. USO could possibly go to $12 short term.
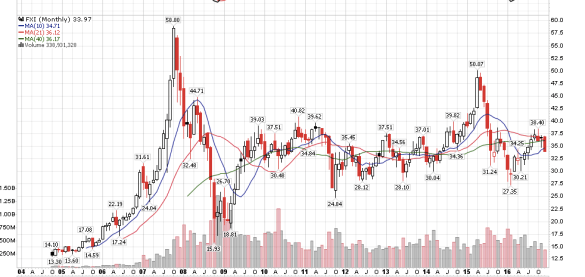
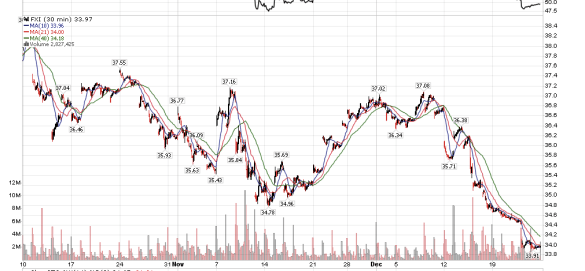
China’s FXI looks like it still has some more downside. I think China could crash into 2020 longer term. I eventually would like to buy into China if it does as I think China will rise from the ashes a lot faster than almost anyone else.
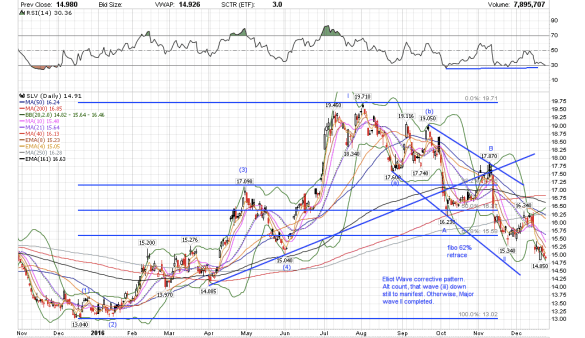
Silver looks like it is so awfully close to a bottom. The silver chart shows a highly corrective pattern. It is not impulsive. I hardly expect silver to break below its December 2015 lows. On the other hand the dollar rally still looks strong, so I have a hard time trust what I see on my chart with regard to silver, but it really does look so close to a buying opportunity.
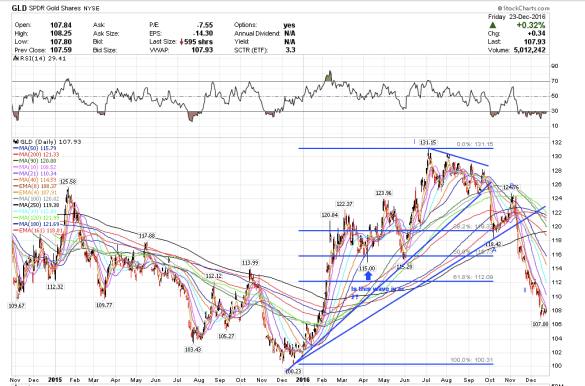
Gold could just keep trending downwards into January until there is a massive capitulation sell-off where sellers who have been holding to the long-side this entire drop down since July just panic and give up to stop the pain. The last wave down is usually the most steep and most dramatic. Gold could just drop $30-50 in one day or night. It is at that time that I will buy, perhaps near the end of January.
I bought FCX and XME at the close yesterday, the only two positions I decided I would try holding over the long weekend. Although both closed under the 4 EMA, making it a little more risky of a trade, their recent lows held and it looks more like a corrective retrace than the start of a new wave down.
XLF and the indices may have completed a bullish consolidation phase on Friday. The XLF closed positive, which looks like it means the financials and the indices are going to rally next week.
On Stocktwits, I read that there were large block trades on GLD and SLV, which is interesting. Since I am not at my regular trading desk, I cannot verify it, but GLD closed green which means it could rally yet again. I have no position other than FCX and XME which have different patterns from GDX, GLD and SLV.
NEM had a really nice rally into the close, barely giving any of it up into the close, and it could very well pop higher on Monday.
TLT also closed green. I closed my TLT and DUST midday.
EWZ looks like it could rally on Monday. UNG looks like it needs to consolidate. The dollar, i.e. UUP, is still consolidating for its next move higher.
Happy Holidays! I wish you much peace, love, joy, and wealth this year and the next! 🙂
9:54 closing all positions and will wait until the close, or Tuesday morning.
9:36 am. I sold short TLT here. It is tagging resistance at the 21 sma on the day chart. I also bought some XME and FCX. I exited CHK and the remainder of UGAZ.
9:05 am PST. I scaled out of UGAZ for +2.13. I am not quite sure where we are in this wave in the larger picture, but I thought it time to exit in the 5-min wave.

