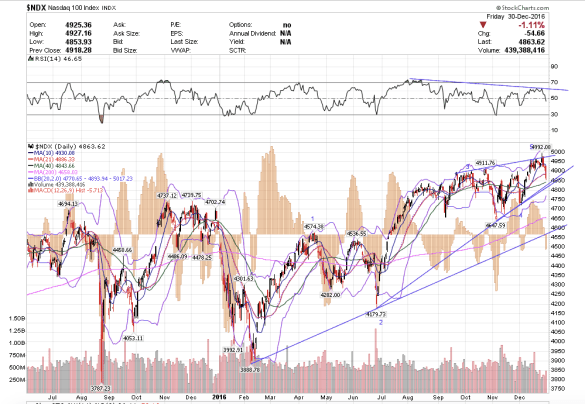
It is quite possible that we may have completed the top of major wave 3 this month, and are heading into a major wave 4, which would be a multi-month corrective triangle with the first sell-off being the steepest.
The daily charts shows negative divergence and a completed five-wave ending diagonal. Once the lower trend line breaks, NDX could pullback as far down as 4200. Just something to watch for.