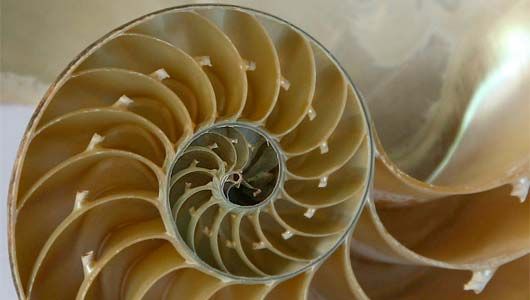
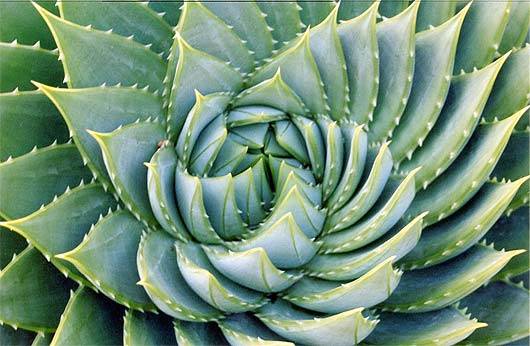
Markets are made up of repeating fractal patterns on every time frame. When first looking at the whole and then going deeper into the minutiae of what makes up a whole, one finds that the minutiae look just like the whole. So it is with the markets.
Do any of the circled price fluctuations look similar?
5-min chart
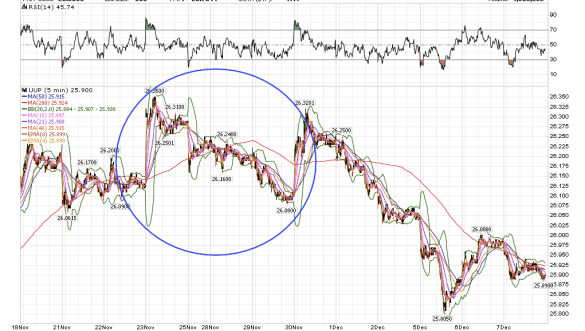
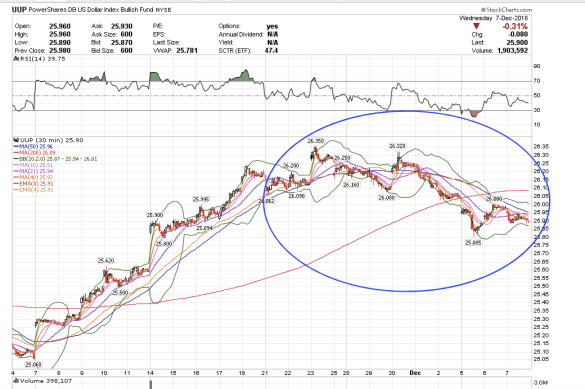
30-minute chart of UUP
Daily chart of the US Dollar
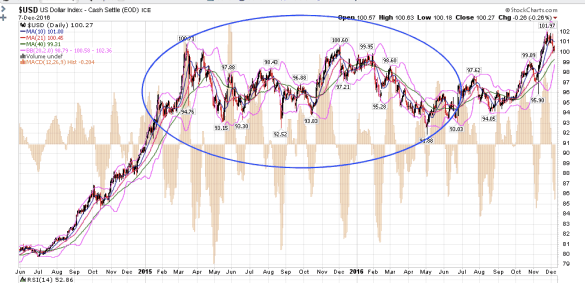
I see the fractal nature of the markets. The price pattern that exists on the 5-min chart shorter time frame looks very similar to the price pattern on the 30-min longer time frame, and just as similar on even longer daily time frame for the same underlying instrument which is the US Dollar.
Corrective price actions look similar with A-B-C waves. Impulsive waves look similar as well. The above U.S. Dollar fractal patterns are corrective in nature.
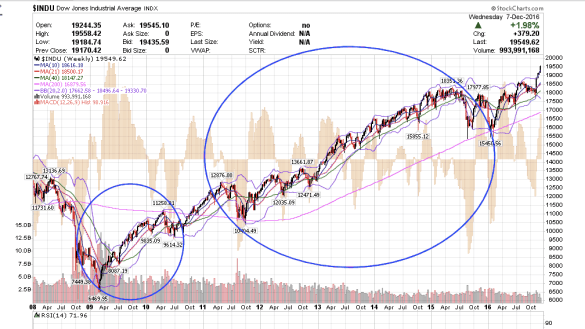
The following are fractal patterns that are impulsive in nature first looking at the larger picture and then zooming into the minutiae:
Within the Dow Weekly the two circled patterns show the first shorter leg at the beginning of the rally looks very similar to the larger middle part. They are fractals of each other both comprising the whole.
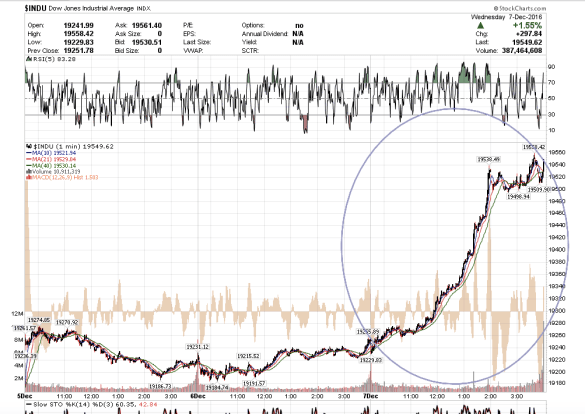
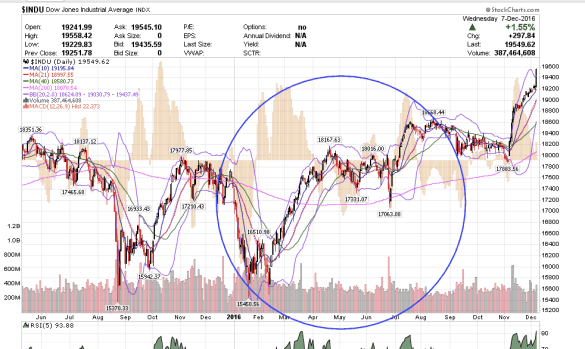
The Dow Daily. Zooming into just this year, the impulsive price action looks just like the fractal at the beginning of this entire rally during 2009.
Here is the Dow on the 1-min. It looks similar to the circled price pattern above.